| __timestamp | Ingersoll Rand Inc. | United Airlines Holdings, Inc. |
|---|---|---|
| Wednesday, January 1, 2014 | 1633224000 | 29569000000 |
| Thursday, January 1, 2015 | 1347800000 | 25952000000 |
| Friday, January 1, 2016 | 1222705000 | 24856000000 |
| Sunday, January 1, 2017 | 1477500000 | 27056000000 |
| Monday, January 1, 2018 | 1677300000 | 30165000000 |
| Tuesday, January 1, 2019 | 1540200000 | 30786000000 |
| Wednesday, January 1, 2020 | 3296800000 | 20385000000 |
| Friday, January 1, 2021 | 3163900000 | 23913000000 |
| Saturday, January 1, 2022 | 3590700000 | 34315000000 |
| Sunday, January 1, 2023 | 3993900000 | 38518000000 |
| Monday, January 1, 2024 | 0 | 37643000000 |
Unveiling the hidden dimensions of data
In the ever-evolving landscape of corporate expenses, understanding cost structures is crucial. This analysis delves into the cost of revenue trends for Ingersoll Rand Inc. and United Airlines Holdings, Inc. from 2014 to 2023. Over this period, Ingersoll Rand's cost of revenue has seen a significant increase, peaking at nearly 4 billion in 2023, marking a 145% rise from 2014. In contrast, United Airlines experienced a more volatile trajectory, with costs fluctuating but ultimately reaching a high of approximately 38.5 billion in 2023, a 30% increase from its lowest point in 2020. This disparity highlights the distinct operational challenges faced by a manufacturing giant versus an airline titan. As businesses navigate post-pandemic recovery, these insights offer a window into strategic financial management and adaptation.
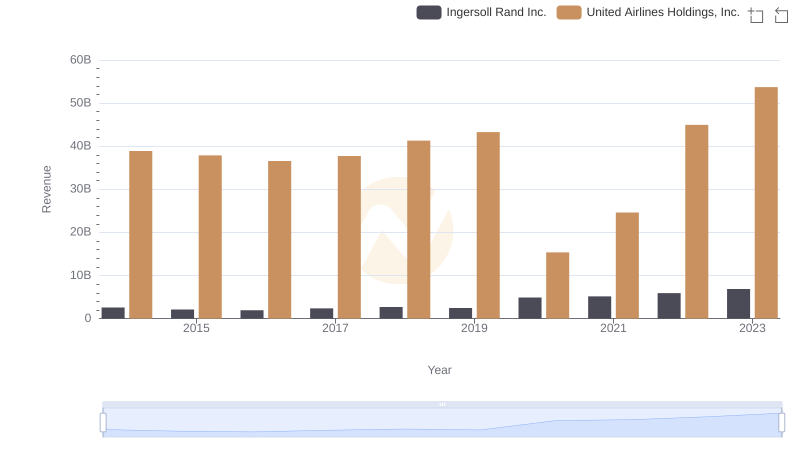
Ingersoll Rand Inc. or United Airlines Holdings, Inc.: Who Leads in Yearly Revenue?
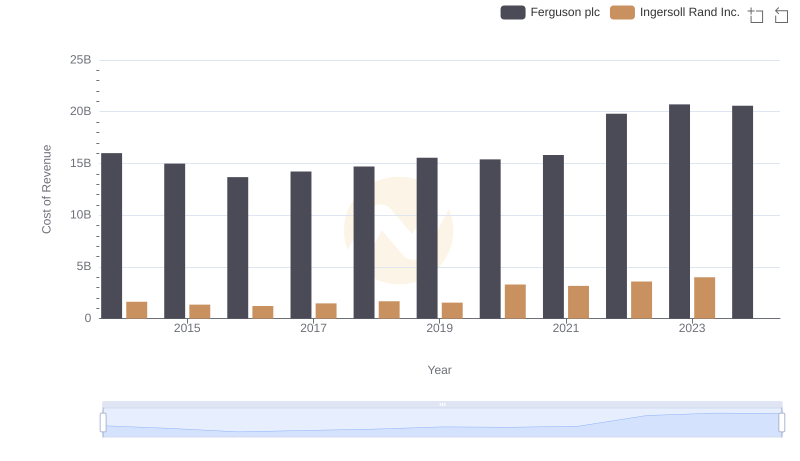
Analyzing Cost of Revenue: Ingersoll Rand Inc. and Ferguson plc
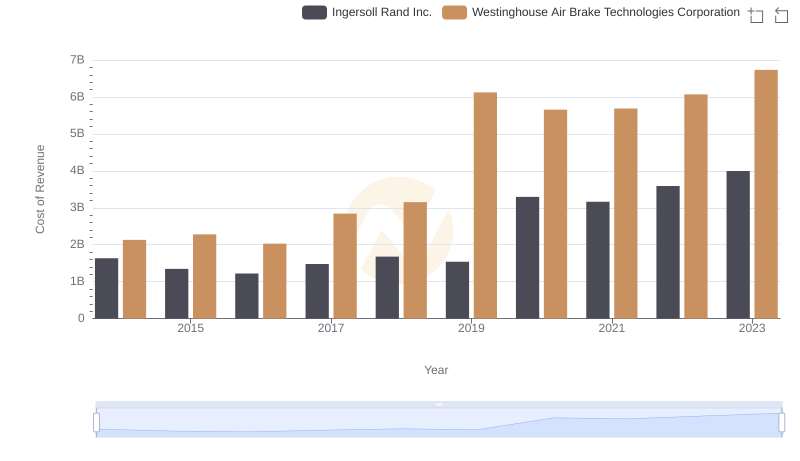
Cost of Revenue Comparison: Ingersoll Rand Inc. vs Westinghouse Air Brake Technologies Corporation
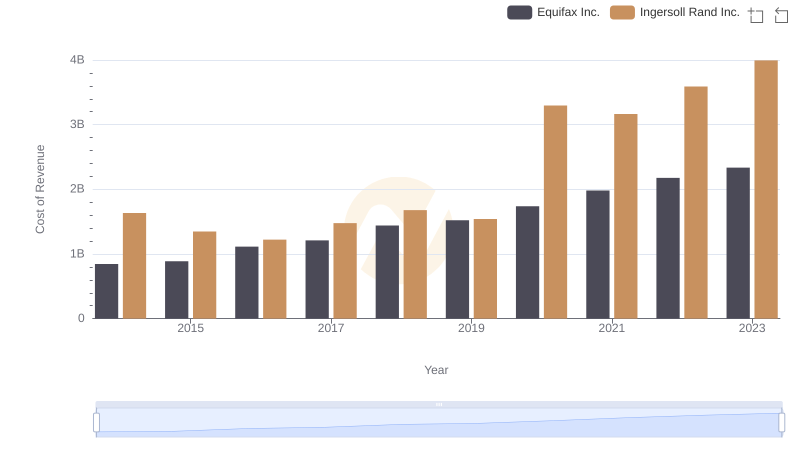
Cost of Revenue: Key Insights for Ingersoll Rand Inc. and Equifax Inc.
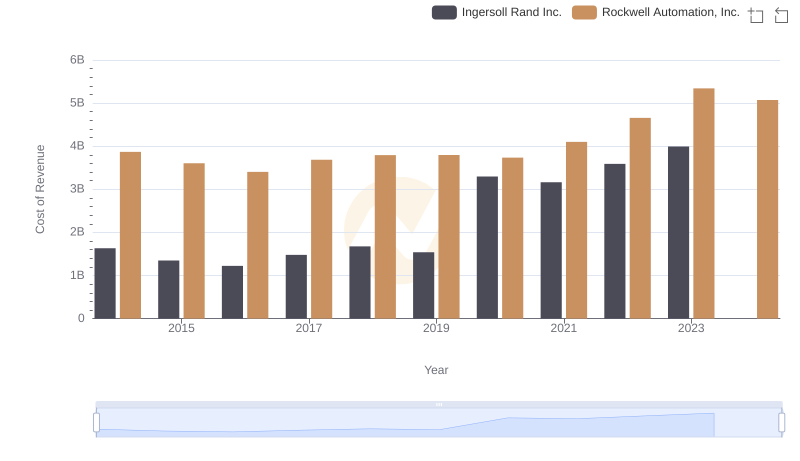
Cost of Revenue Trends: Ingersoll Rand Inc. vs Rockwell Automation, Inc.
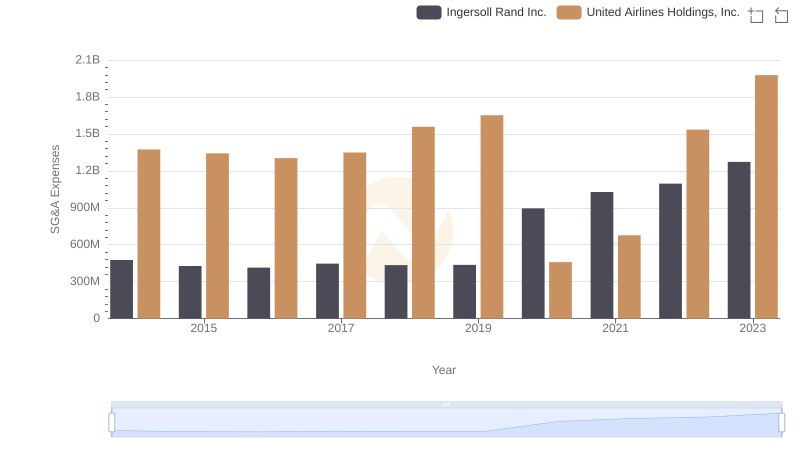
SG&A Efficiency Analysis: Comparing Ingersoll Rand Inc. and United Airlines Holdings, Inc.