| __timestamp | Ingersoll Rand Inc. | Rockwell Automation, Inc. |
|---|---|---|
| Wednesday, January 1, 2014 | 476000000 | 1570100000 |
| Thursday, January 1, 2015 | 427000000 | 1506400000 |
| Friday, January 1, 2016 | 414339000 | 1467400000 |
| Sunday, January 1, 2017 | 446600000 | 1591500000 |
| Monday, January 1, 2018 | 434600000 | 1599000000 |
| Tuesday, January 1, 2019 | 436400000 | 1538500000 |
| Wednesday, January 1, 2020 | 894800000 | 1479800000 |
| Friday, January 1, 2021 | 1028000000 | 1680000000 |
| Saturday, January 1, 2022 | 1095800000 | 1766700000 |
| Sunday, January 1, 2023 | 1272700000 | 2023700000 |
| Monday, January 1, 2024 | 0 | 2002600000 |
Unleashing insights
In the competitive landscape of industrial manufacturing, understanding the financial strategies of key players is crucial. Ingersoll Rand Inc. and Rockwell Automation, Inc. have been pivotal in shaping the industry. From 2014 to 2023, Rockwell Automation consistently outpaced Ingersoll Rand in Selling, General, and Administrative (SG&A) expenses, with a peak in 2023 reaching approximately 2 billion USD. This represents a 29% increase from 2014. In contrast, Ingersoll Rand's SG&A expenses grew by 167% over the same period, peaking at around 1.27 billion USD in 2023. This significant rise reflects strategic investments and expansions. However, the data for 2024 is incomplete, leaving room for speculation on future trends. As these companies continue to evolve, their financial strategies will undoubtedly influence their market positions and industry dynamics.
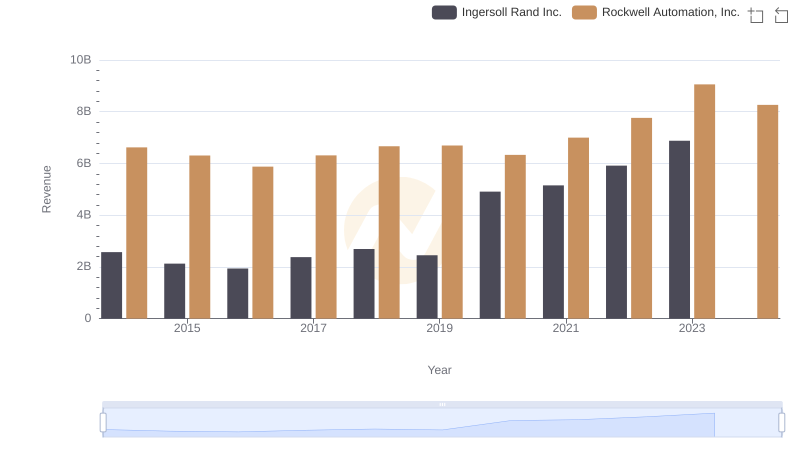
Breaking Down Revenue Trends: Ingersoll Rand Inc. vs Rockwell Automation, Inc.
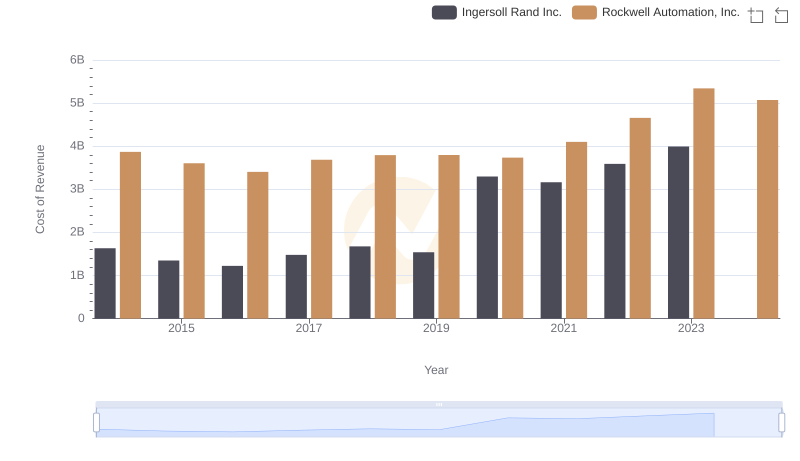
Cost of Revenue Trends: Ingersoll Rand Inc. vs Rockwell Automation, Inc.
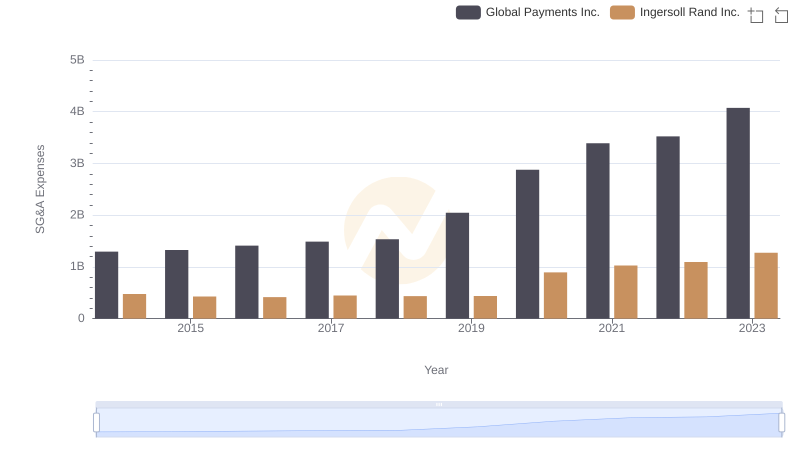
Cost Management Insights: SG&A Expenses for Ingersoll Rand Inc. and Global Payments Inc.
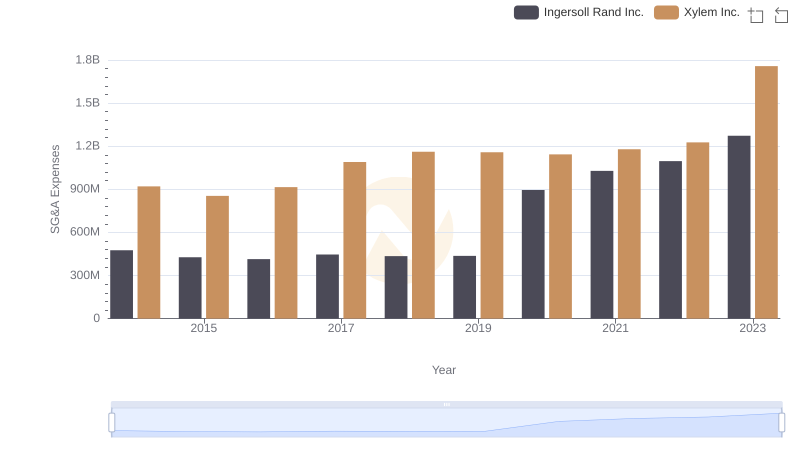
Operational Costs Compared: SG&A Analysis of Ingersoll Rand Inc. and Xylem Inc.
SG&A Efficiency Analysis: Comparing Ingersoll Rand Inc. and Dover Corporation

Cost Management Insights: SG&A Expenses for Ingersoll Rand Inc. and Builders FirstSource, Inc.