| __timestamp | Cisco Systems, Inc. | Guidewire Software, Inc. |
|---|---|---|
| Wednesday, January 1, 2014 | 11437000000 | 106699000 |
| Thursday, January 1, 2015 | 11861000000 | 123420000 |
| Friday, January 1, 2016 | 11433000000 | 143679000 |
| Sunday, January 1, 2017 | 11177000000 | 165790000 |
| Monday, January 1, 2018 | 11386000000 | 200033000 |
| Tuesday, January 1, 2019 | 11398000000 | 205152000 |
| Wednesday, January 1, 2020 | 11094000000 | 227603000 |
| Friday, January 1, 2021 | 11411000000 | 254303000 |
| Saturday, January 1, 2022 | 11186000000 | 302002000 |
| Sunday, January 1, 2023 | 12358000000 | 357955000 |
| Monday, January 1, 2024 | 13177000000 | 366553000 |
Unlocking the unknown
In the ever-evolving tech industry, understanding financial trends is crucial for investors and analysts alike. This article delves into the Selling, General, and Administrative (SG&A) expenses of two tech giants: Cisco Systems, Inc. and Guidewire Software, Inc., from 2014 to 2024.
Cisco, a leader in networking solutions, has consistently maintained high SG&A expenses, averaging around $11.6 billion annually. Notably, from 2022 to 2024, Cisco's SG&A expenses surged by approximately 18%, reflecting strategic investments in innovation and market expansion.
Conversely, Guidewire, a key player in the insurance software sector, exhibited a more dynamic growth pattern. Starting at $107 million in 2014, Guidewire's SG&A expenses increased by over 240% by 2024, highlighting its aggressive growth strategy and market penetration efforts.
These trends underscore the contrasting strategies of these companies: Cisco's steady investment in sustaining market leadership and Guidewire's rapid expansion in a competitive niche.
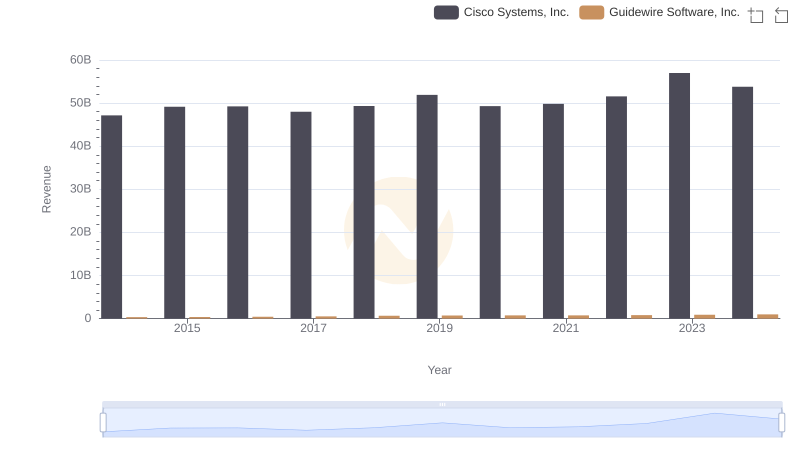
Breaking Down Revenue Trends: Cisco Systems, Inc. vs Guidewire Software, Inc.
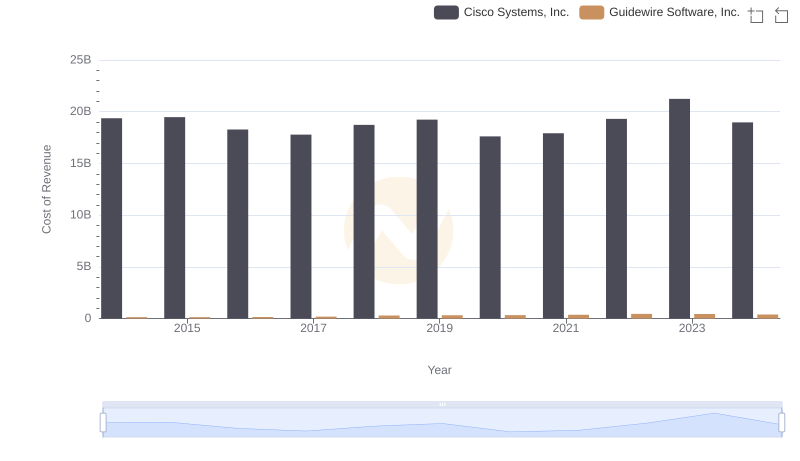
Cost of Revenue Trends: Cisco Systems, Inc. vs Guidewire Software, Inc.
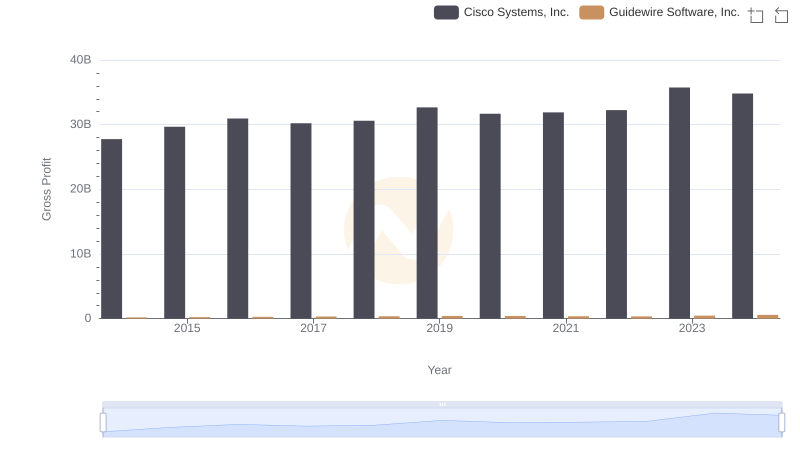
Gross Profit Analysis: Comparing Cisco Systems, Inc. and Guidewire Software, Inc.
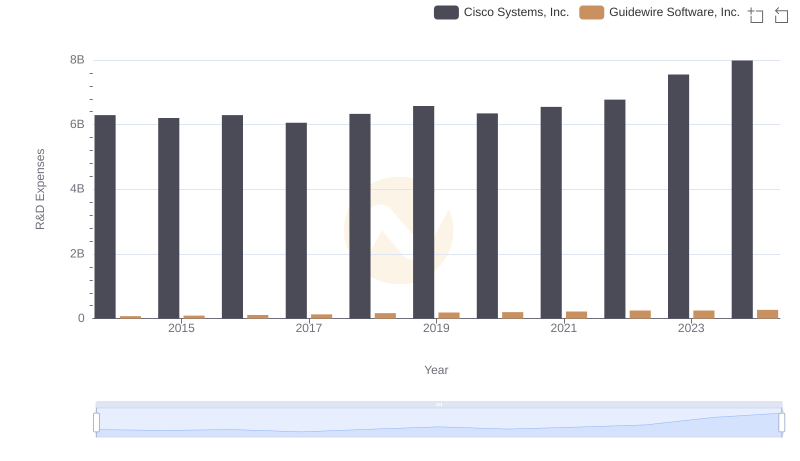
Who Prioritizes Innovation? R&D Spending Compared for Cisco Systems, Inc. and Guidewire Software, Inc.
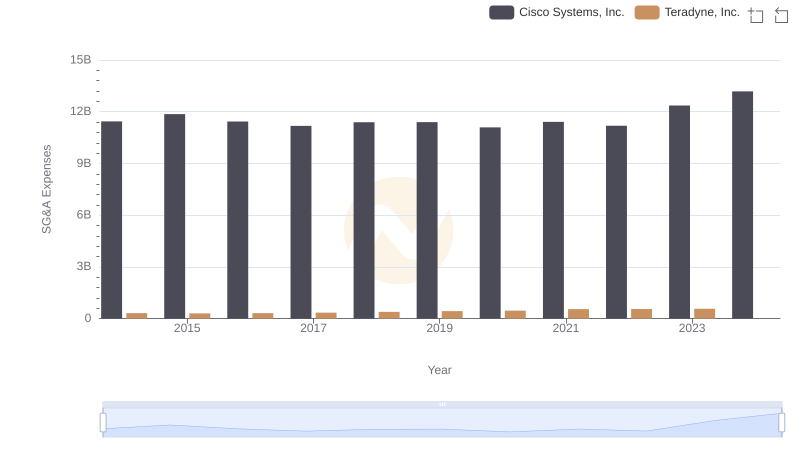
Cisco Systems, Inc. or Teradyne, Inc.: Who Manages SG&A Costs Better?
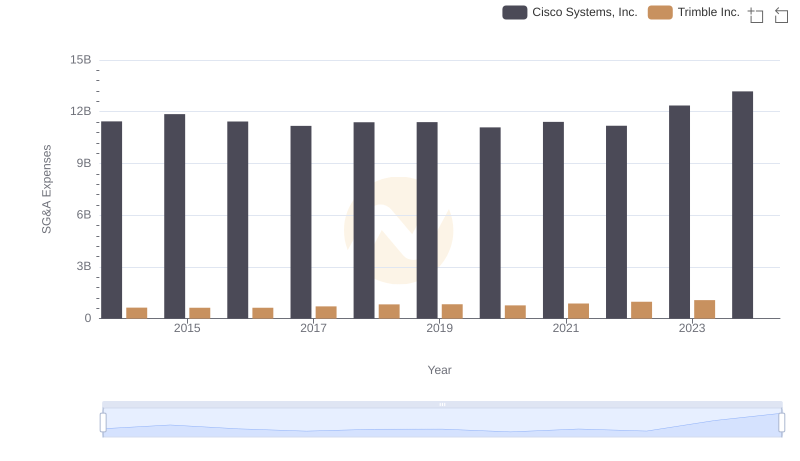
Cost Management Insights: SG&A Expenses for Cisco Systems, Inc. and Trimble Inc.
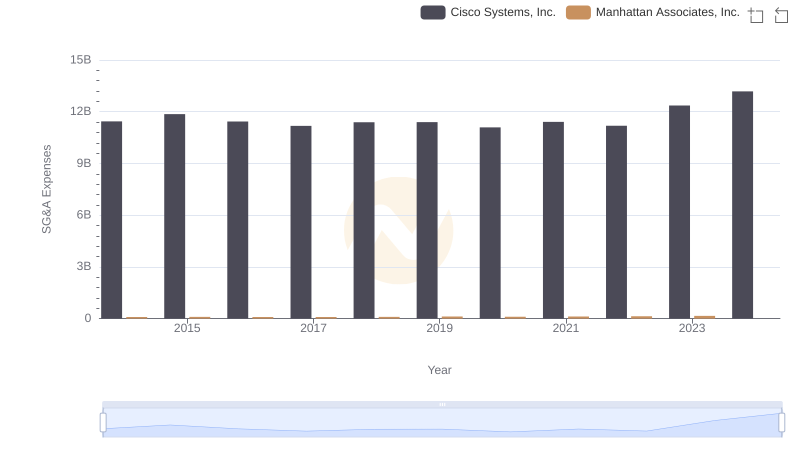
Who Optimizes SG&A Costs Better? Cisco Systems, Inc. or Manhattan Associates, Inc.
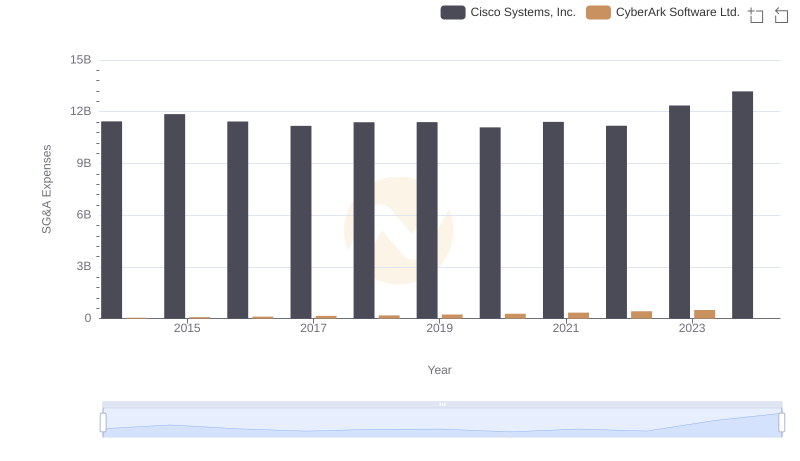
SG&A Efficiency Analysis: Comparing Cisco Systems, Inc. and CyberArk Software Ltd.
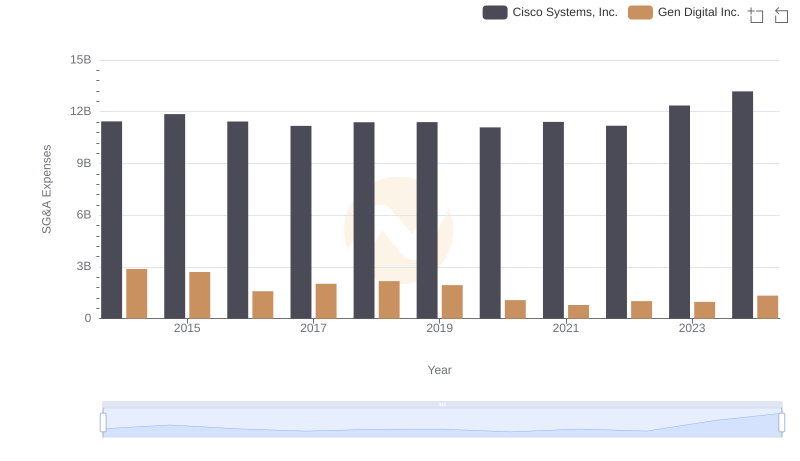
SG&A Efficiency Analysis: Comparing Cisco Systems, Inc. and Gen Digital Inc.
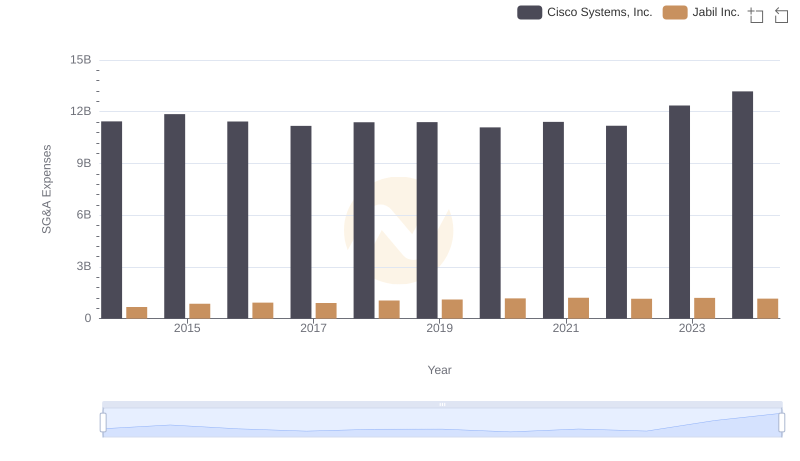
SG&A Efficiency Analysis: Comparing Cisco Systems, Inc. and Jabil Inc.

Cisco Systems, Inc. and Super Micro Computer, Inc.: SG&A Spending Patterns Compared
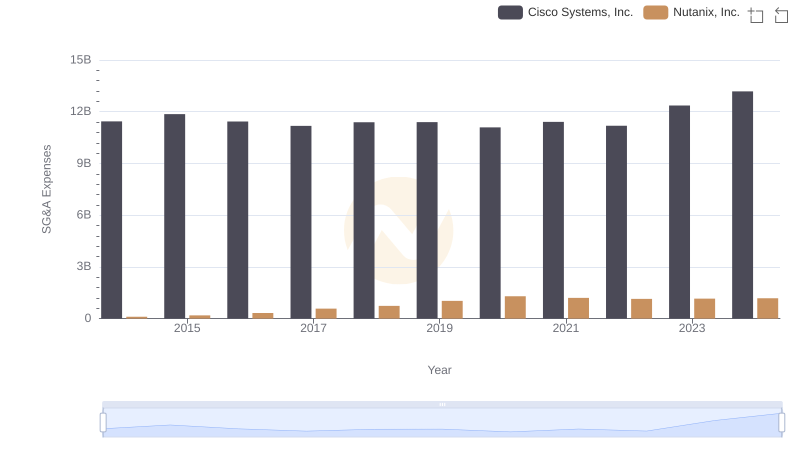
Breaking Down SG&A Expenses: Cisco Systems, Inc. vs Nutanix, Inc.