| __timestamp | Watsco, Inc. | XPO Logistics, Inc. |
|---|---|---|
| Wednesday, January 1, 2014 | 650655000 | 422500000 |
| Thursday, January 1, 2015 | 670609000 | 1113400000 |
| Friday, January 1, 2016 | 688952000 | 1651200000 |
| Sunday, January 1, 2017 | 715671000 | 1656500000 |
| Monday, January 1, 2018 | 757452000 | 1837000000 |
| Tuesday, January 1, 2019 | 800328000 | 1845000000 |
| Wednesday, January 1, 2020 | 833051000 | 2172000000 |
| Friday, January 1, 2021 | 1058316000 | 1322000000 |
| Saturday, January 1, 2022 | 1221382000 | 678000000 |
| Sunday, January 1, 2023 | 1185626000 | 167000000 |
| Monday, January 1, 2024 | 1262938000 | 134000000 |
Unveiling the hidden dimensions of data
In the competitive landscape of corporate America, understanding the financial health of a company is crucial. Selling, General, and Administrative (SG&A) expenses are a key indicator of operational efficiency. This analysis compares the SG&A expenses of Watsco, Inc. and XPO Logistics, Inc. from 2014 to 2023.
Watsco, Inc., a leader in HVAC distribution, has seen a steady increase in SG&A expenses, peaking in 2022 with a 47% rise from 2014. This growth reflects their expanding market presence and operational investments. In contrast, XPO Logistics, Inc., a major player in transportation and logistics, experienced a dramatic fluctuation. Their SG&A expenses surged by 414% from 2014 to 2020, followed by a sharp decline of 92% by 2023. This volatility highlights the dynamic nature of the logistics industry and XPO's strategic shifts.
These trends underscore the importance of strategic financial management in sustaining growth and competitiveness.
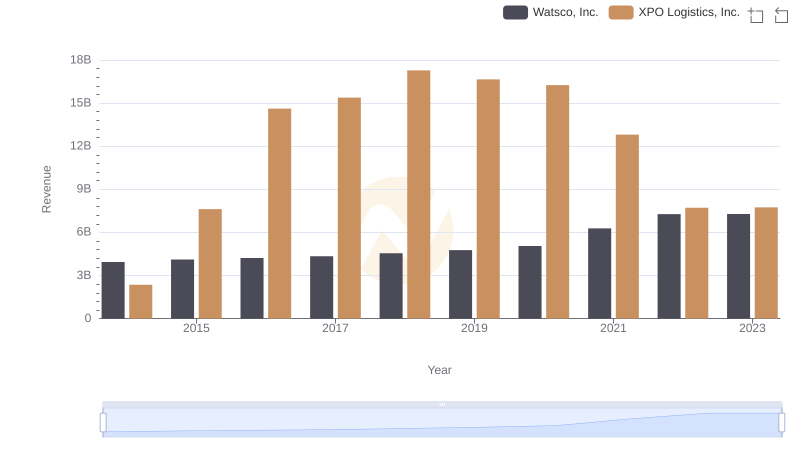
Annual Revenue Comparison: Watsco, Inc. vs XPO Logistics, Inc.
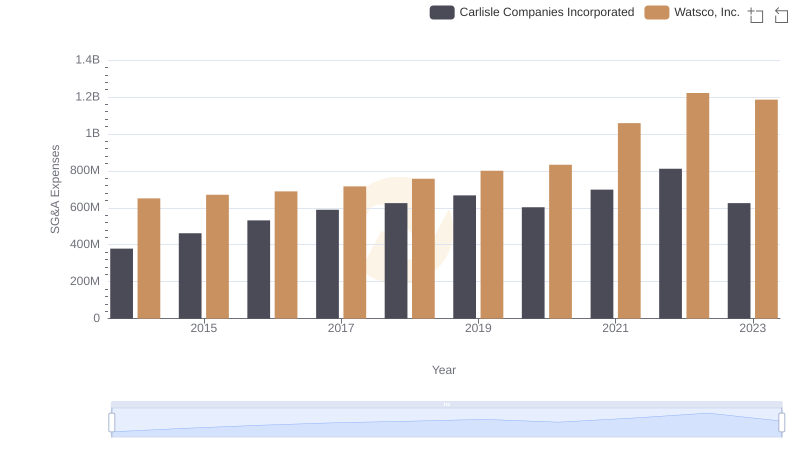
Watsco, Inc. and Carlisle Companies Incorporated: SG&A Spending Patterns Compared
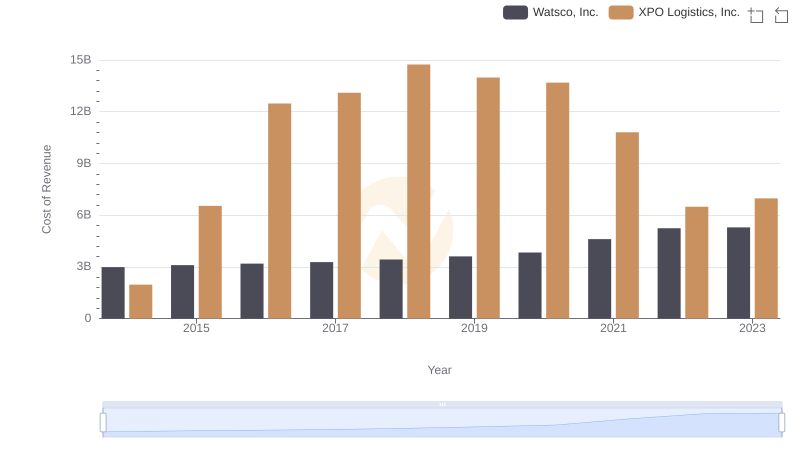
Comparing Cost of Revenue Efficiency: Watsco, Inc. vs XPO Logistics, Inc.
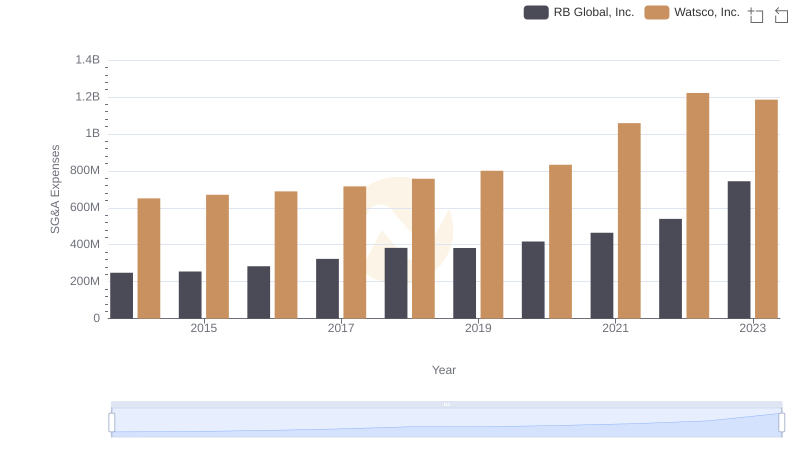
Selling, General, and Administrative Costs: Watsco, Inc. vs RB Global, Inc.
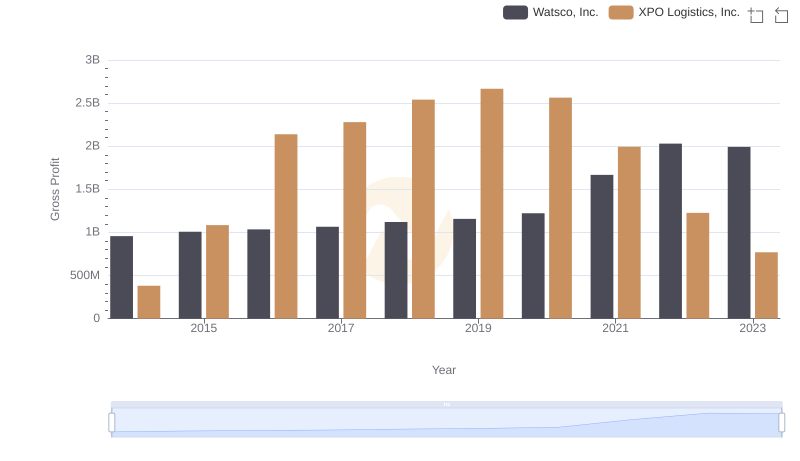
Watsco, Inc. vs XPO Logistics, Inc.: A Gross Profit Performance Breakdown
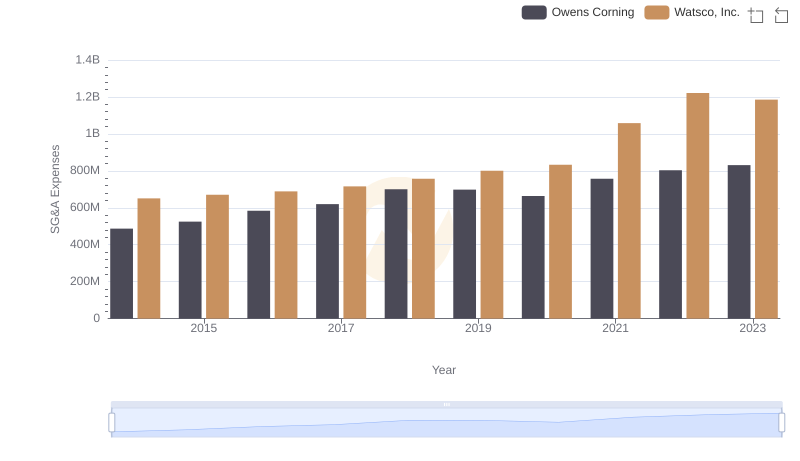
Selling, General, and Administrative Costs: Watsco, Inc. vs Owens Corning
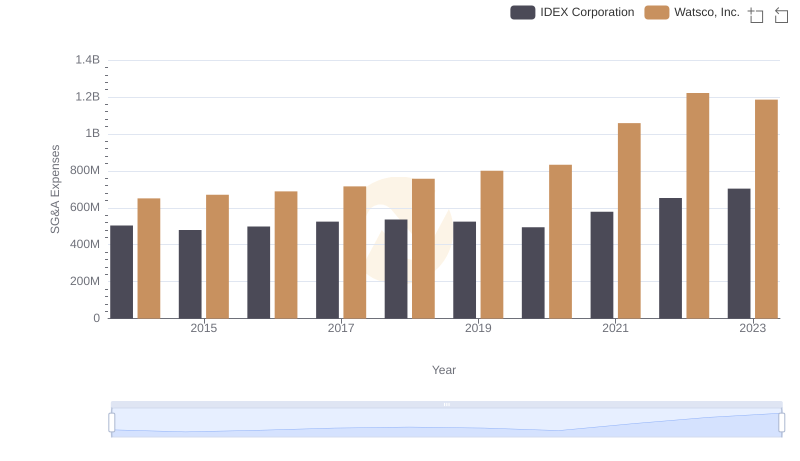
Comparing SG&A Expenses: Watsco, Inc. vs IDEX Corporation Trends and Insights
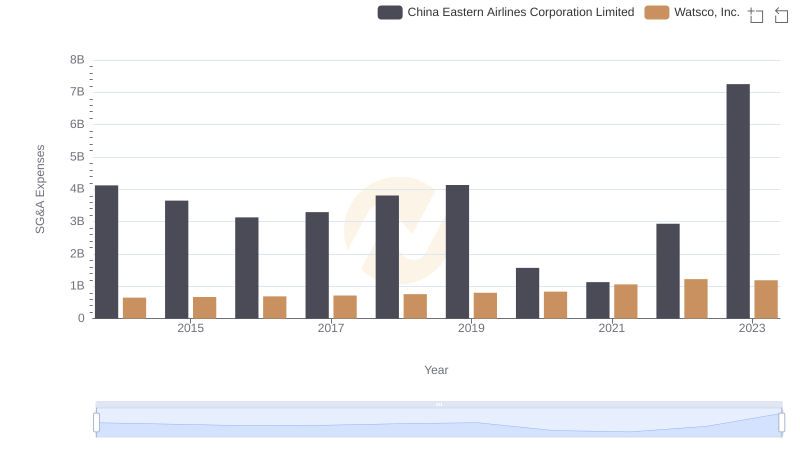
Cost Management Insights: SG&A Expenses for Watsco, Inc. and China Eastern Airlines Corporation Limited
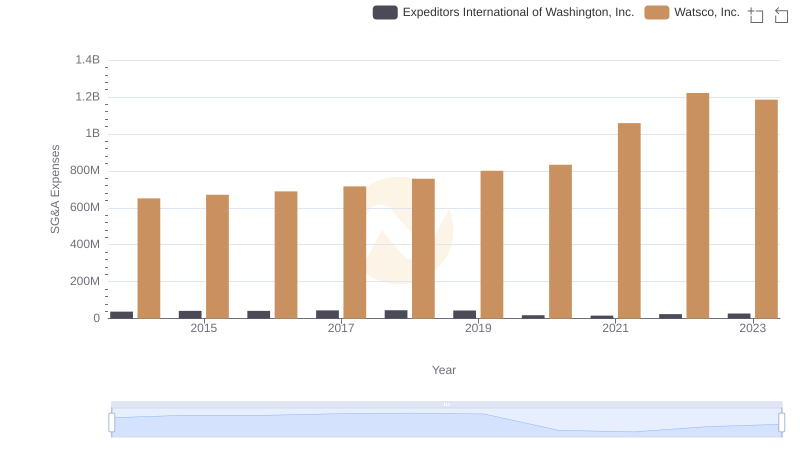
SG&A Efficiency Analysis: Comparing Watsco, Inc. and Expeditors International of Washington, Inc.
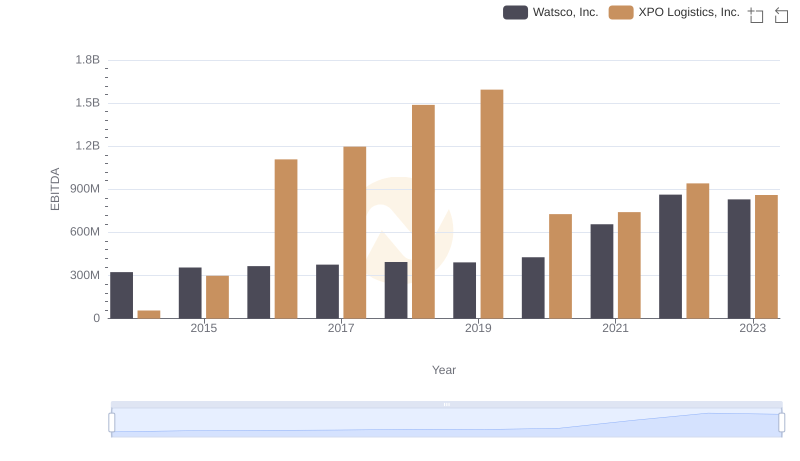
Comparative EBITDA Analysis: Watsco, Inc. vs XPO Logistics, Inc.