| __timestamp | Cintas Corporation | U-Haul Holding Company |
|---|---|---|
| Wednesday, January 1, 2014 | 1302752000 | 257168000 |
| Thursday, January 1, 2015 | 1224930000 | 238558000 |
| Friday, January 1, 2016 | 1348122000 | 217216000 |
| Sunday, January 1, 2017 | 1527380000 | 220053000 |
| Monday, January 1, 2018 | 1916792000 | 219271000 |
| Tuesday, January 1, 2019 | 1980644000 | 133435000 |
| Wednesday, January 1, 2020 | 2071052000 | 201718000 |
| Friday, January 1, 2021 | 1929159000 | 207982000 |
| Saturday, January 1, 2022 | 2044876000 | 216557000 |
| Sunday, January 1, 2023 | 2370704000 | 58753000 |
| Monday, January 1, 2024 | 2617783000 | 32654000 |
Unlocking the unknown
In the ever-evolving landscape of corporate finance, understanding the trends in Selling, General, and Administrative (SG&A) expenses is crucial for investors and analysts alike. Over the past decade, Cintas Corporation has demonstrated a robust upward trajectory in its SG&A expenses, growing by approximately 101% from 2014 to 2024. This reflects the company's strategic investments in operational efficiency and market expansion. In contrast, U-Haul Holding Company has experienced a more volatile pattern, with a notable decline of around 87% in SG&A expenses over the same period. This could indicate a shift in business strategy or cost-cutting measures. The data highlights the contrasting financial strategies of these two industry giants, offering valuable insights into their operational priorities and market positioning.
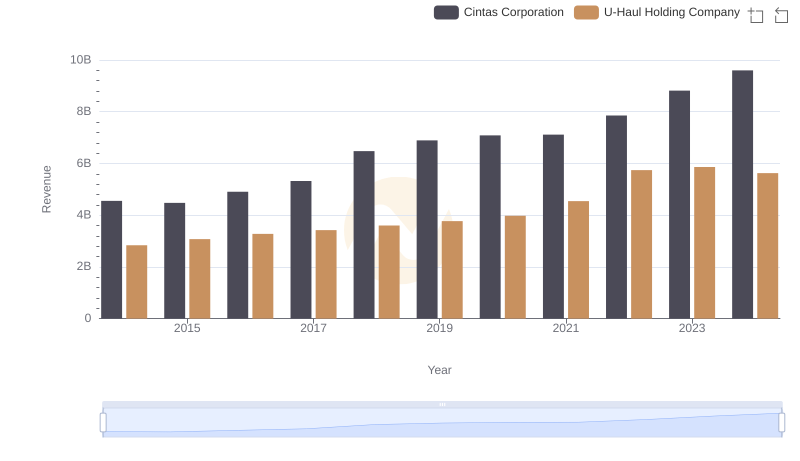
Who Generates More Revenue? Cintas Corporation or U-Haul Holding Company
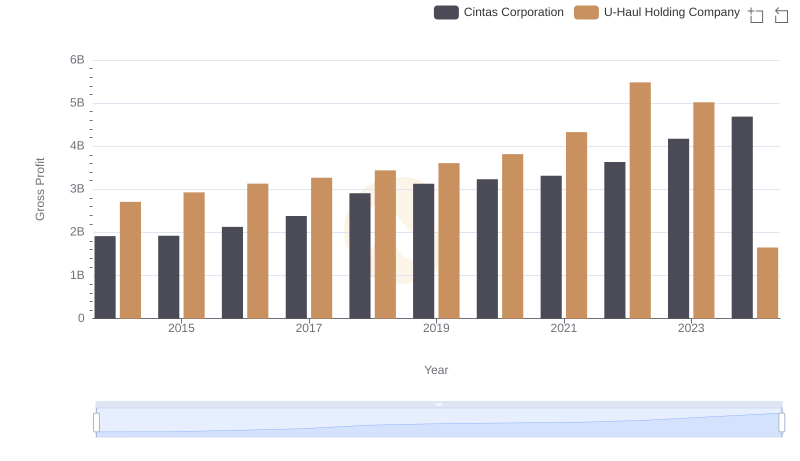
Gross Profit Analysis: Comparing Cintas Corporation and U-Haul Holding Company
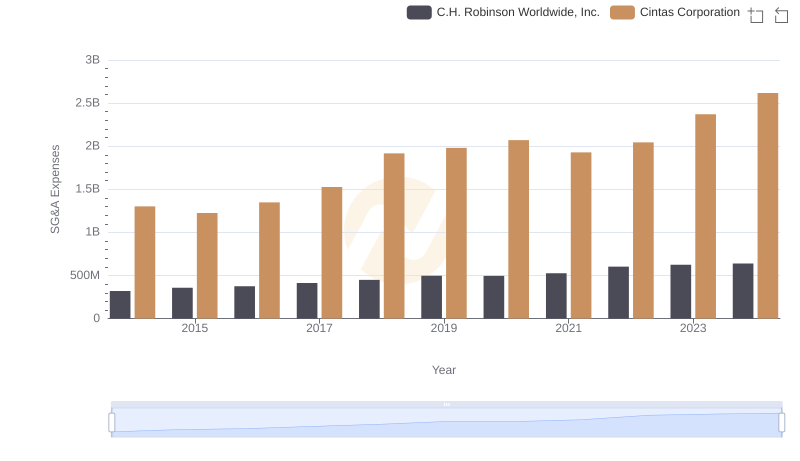
Cintas Corporation or C.H. Robinson Worldwide, Inc.: Who Manages SG&A Costs Better?
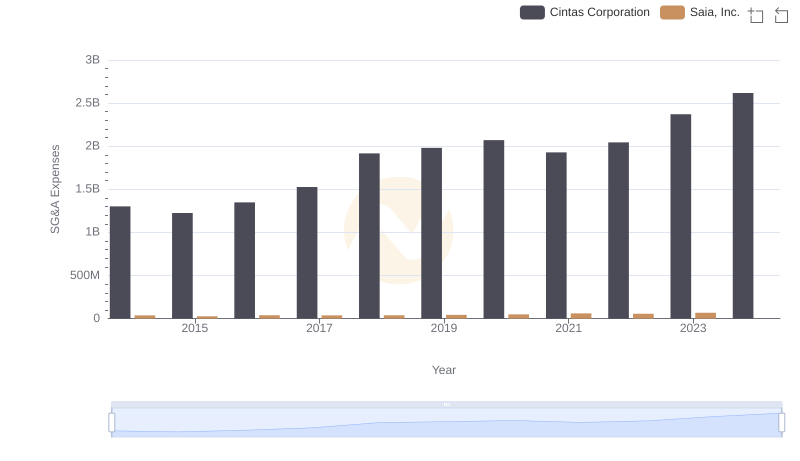
Selling, General, and Administrative Costs: Cintas Corporation vs Saia, Inc.
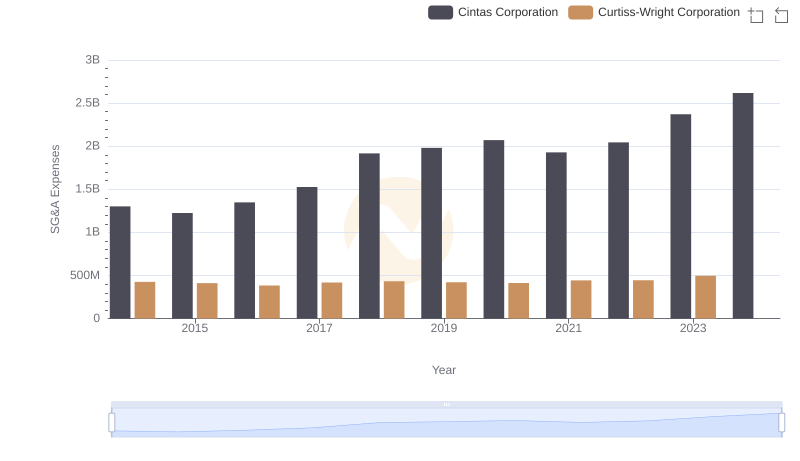
Who Optimizes SG&A Costs Better? Cintas Corporation or Curtiss-Wright Corporation
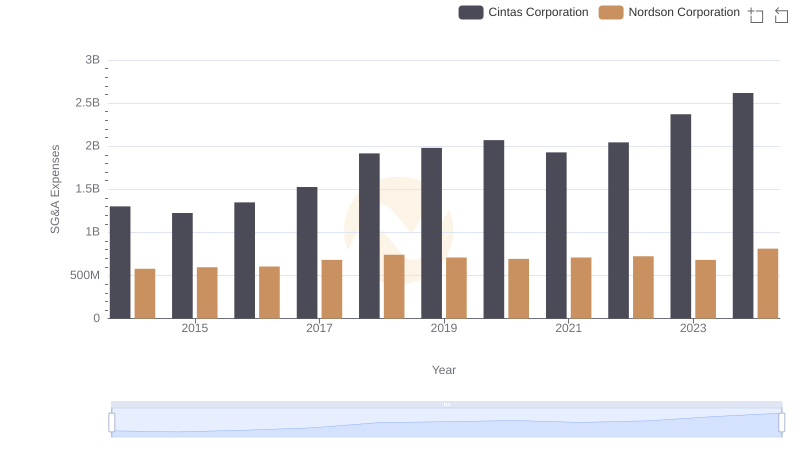
Breaking Down SG&A Expenses: Cintas Corporation vs Nordson Corporation