| __timestamp | Graco Inc. | Ryanair Holdings plc |
|---|---|---|
| Wednesday, January 1, 2014 | 303565000 | 192800000 |
| Thursday, January 1, 2015 | 324016000 | 233900000 |
| Friday, January 1, 2016 | 341734000 | 292700000 |
| Sunday, January 1, 2017 | 372496000 | 322300000 |
| Monday, January 1, 2018 | 382988000 | 410400000 |
| Tuesday, January 1, 2019 | 367743000 | 547300000 |
| Wednesday, January 1, 2020 | 355796000 | 578800000 |
| Friday, January 1, 2021 | 422975000 | 201500000 |
| Saturday, January 1, 2022 | 404731000 | 411300000 |
| Sunday, January 1, 2023 | 432156000 | 674400000 |
| Monday, January 1, 2024 | 465133000 | 757200000 |
Igniting the spark of knowledge
In the world of corporate finance, understanding a company's spending patterns can reveal much about its strategic priorities. Over the past decade, Ryanair Holdings plc and Graco Inc. have showcased distinct trends in their Selling, General, and Administrative (SG&A) expenses. From 2014 to 2024, Ryanair's SG&A expenses surged by nearly 293%, reflecting its aggressive expansion and marketing strategies. In contrast, Graco Inc. demonstrated a more conservative growth of approximately 53% in the same period, indicative of its steady operational focus.
Ryanair's expenses peaked in 2024, with a notable dip in 2021, possibly due to pandemic-related disruptions. Meanwhile, Graco's spending remained relatively stable, with a gradual increase, highlighting its resilience and consistent market approach. These patterns not only underscore the companies' differing business models but also offer insights into their future trajectories.
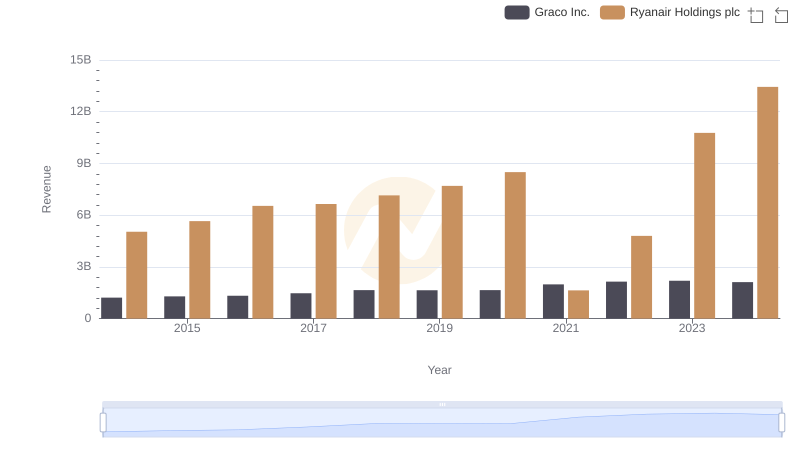
Ryanair Holdings plc and Graco Inc.: A Comprehensive Revenue Analysis
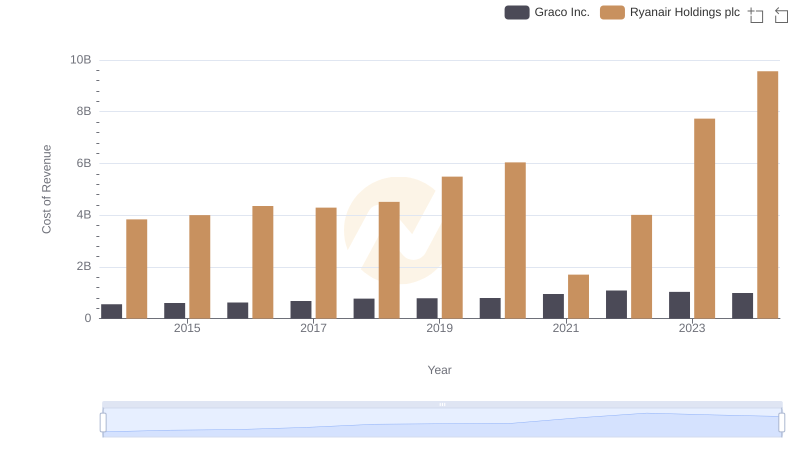
Ryanair Holdings plc vs Graco Inc.: Efficiency in Cost of Revenue Explored
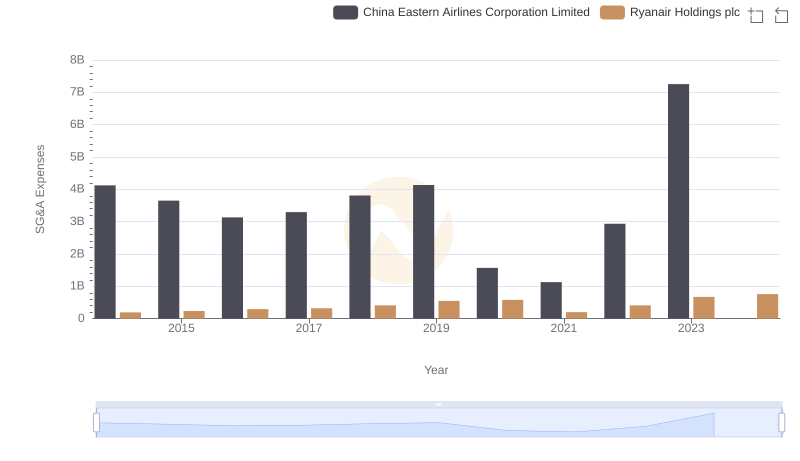
Ryanair Holdings plc vs China Eastern Airlines Corporation Limited: SG&A Expense Trends
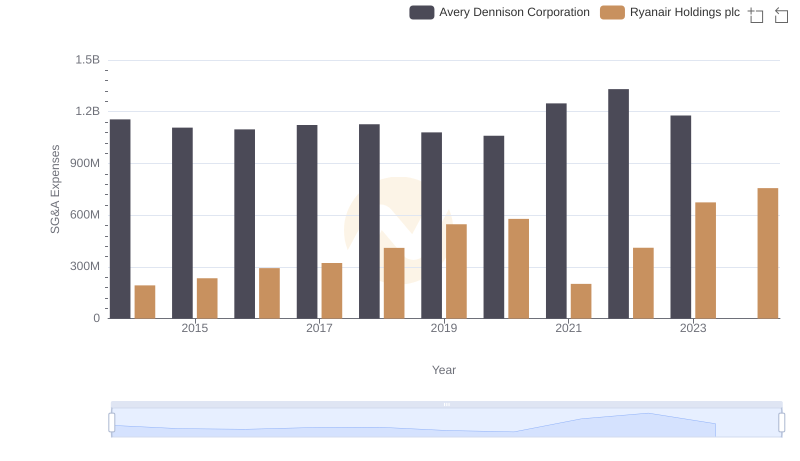
Breaking Down SG&A Expenses: Ryanair Holdings plc vs Avery Dennison Corporation
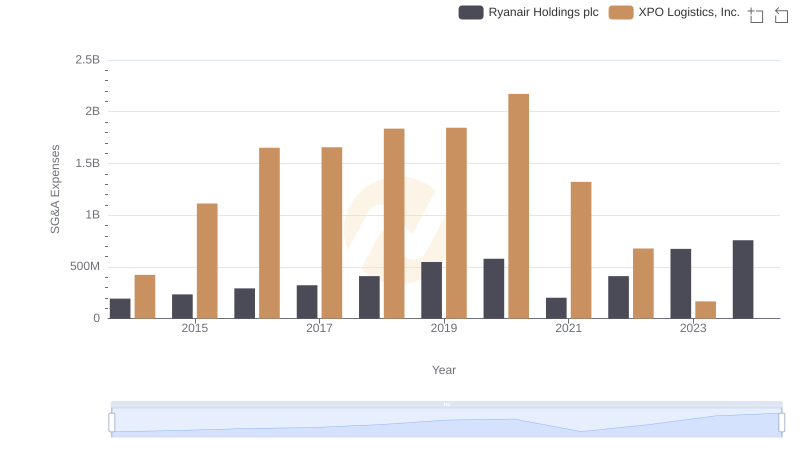
Breaking Down SG&A Expenses: Ryanair Holdings plc vs XPO Logistics, Inc.
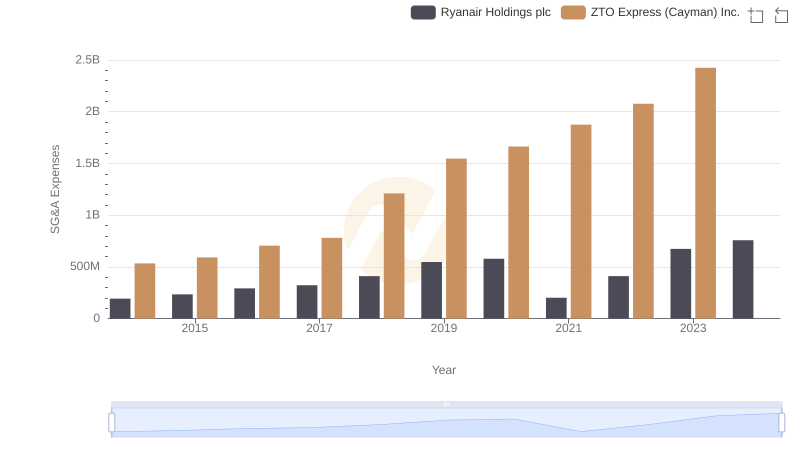
Breaking Down SG&A Expenses: Ryanair Holdings plc vs ZTO Express (Cayman) Inc.
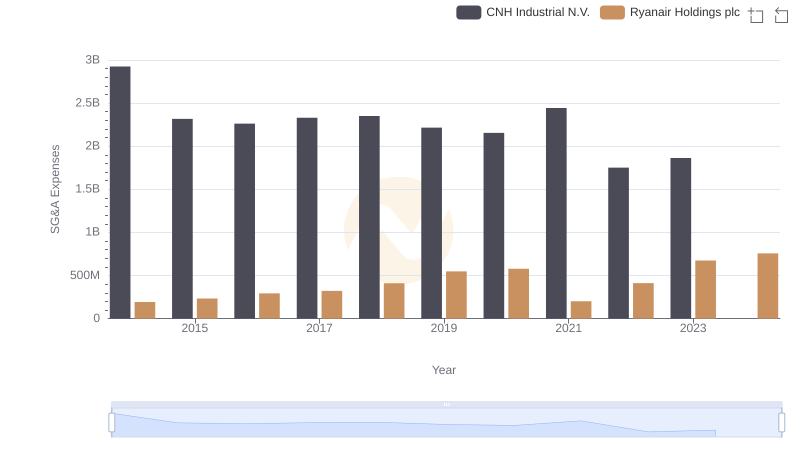
Cost Management Insights: SG&A Expenses for Ryanair Holdings plc and CNH Industrial N.V.

Who Optimizes SG&A Costs Better? Ryanair Holdings plc or AECOM
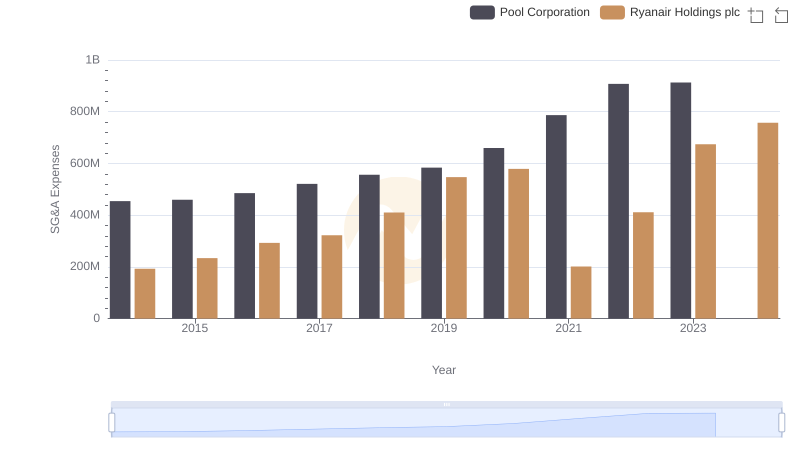
Breaking Down SG&A Expenses: Ryanair Holdings plc vs Pool Corporation
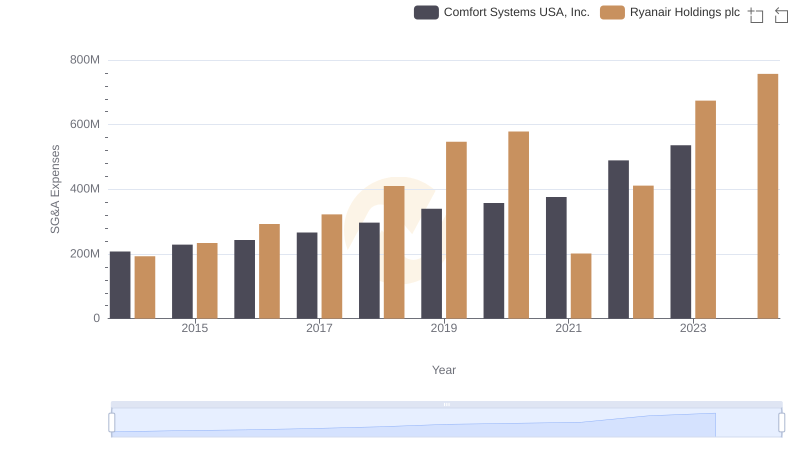
SG&A Efficiency Analysis: Comparing Ryanair Holdings plc and Comfort Systems USA, Inc.
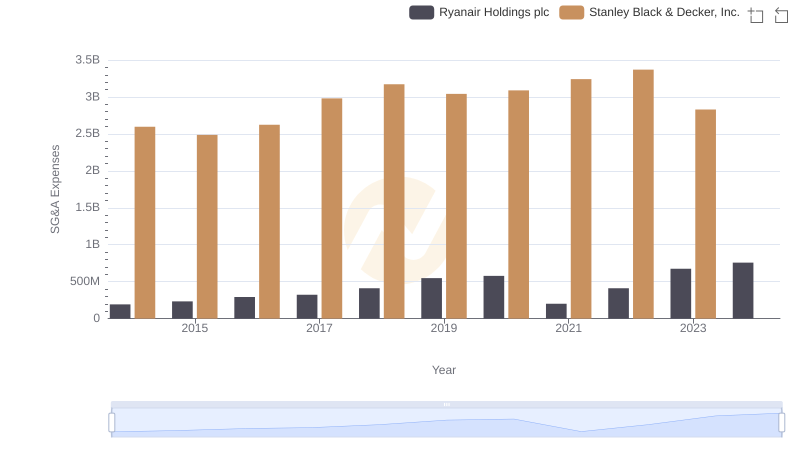
SG&A Efficiency Analysis: Comparing Ryanair Holdings plc and Stanley Black & Decker, Inc.
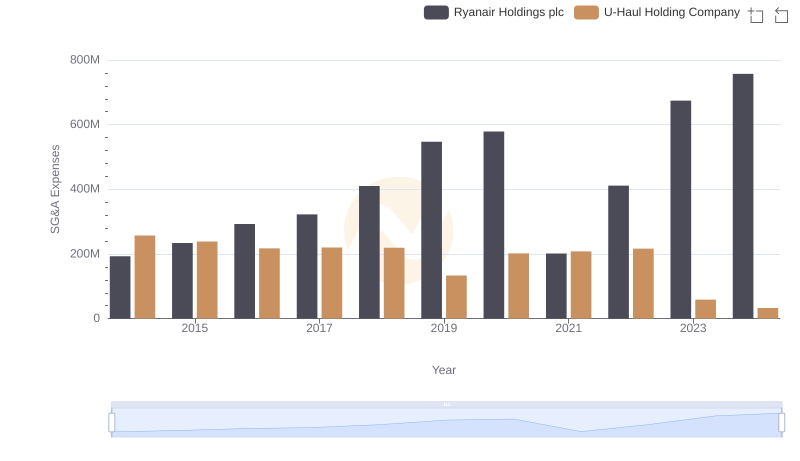
Selling, General, and Administrative Costs: Ryanair Holdings plc vs U-Haul Holding Company