| __timestamp | Parker-Hannifin Corporation | Union Pacific Corporation |
|---|---|---|
| Wednesday, January 1, 2014 | 13215971000 | 23988000000 |
| Thursday, January 1, 2015 | 12711744000 | 21813000000 |
| Friday, January 1, 2016 | 11360753000 | 19941000000 |
| Sunday, January 1, 2017 | 12029312000 | 21240000000 |
| Monday, January 1, 2018 | 14302392000 | 22832000000 |
| Tuesday, January 1, 2019 | 14320324000 | 21708000000 |
| Wednesday, January 1, 2020 | 13695520000 | 19533000000 |
| Friday, January 1, 2021 | 14347640000 | 21804000000 |
| Saturday, January 1, 2022 | 15861608000 | 24875000000 |
| Sunday, January 1, 2023 | 19065194000 | 24119000000 |
| Monday, January 1, 2024 | 19929606000 | 24250000000 |
Data in motion
In the competitive landscape of American industry, Union Pacific Corporation and Parker-Hannifin Corporation stand as titans in their respective fields. Over the past decade, Union Pacific, a leader in rail transportation, consistently outpaced Parker-Hannifin, a key player in motion and control technologies, in revenue generation. From 2014 to 2023, Union Pacific's revenue averaged around 22 billion annually, peaking in 2022 with a 25% increase from its 2016 low. Meanwhile, Parker-Hannifin saw a steady climb, culminating in a 40% rise by 2023 compared to 2016. Despite Parker-Hannifin's impressive growth, Union Pacific maintained a revenue lead of approximately 50% each year. The data for 2024 is incomplete, but the trend suggests Parker-Hannifin is closing the gap. This financial duel highlights the dynamic nature of industrial growth and the resilience of these corporate giants.
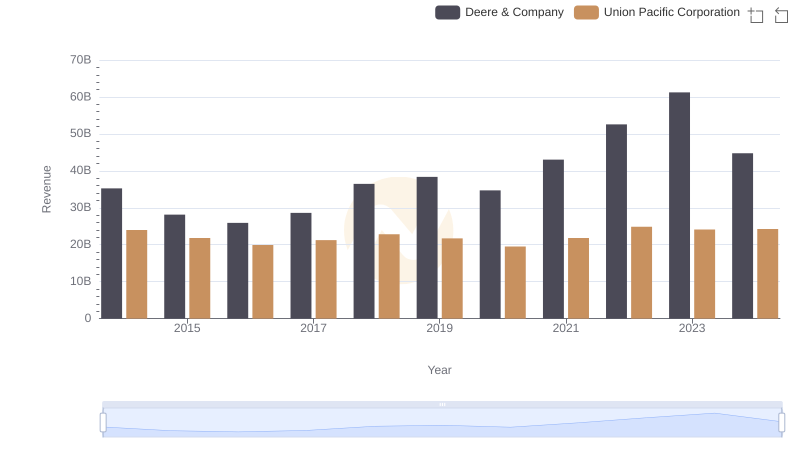
Union Pacific Corporation vs Deere & Company: Examining Key Revenue Metrics

Breaking Down Revenue Trends: Union Pacific Corporation vs United Parcel Service, Inc.
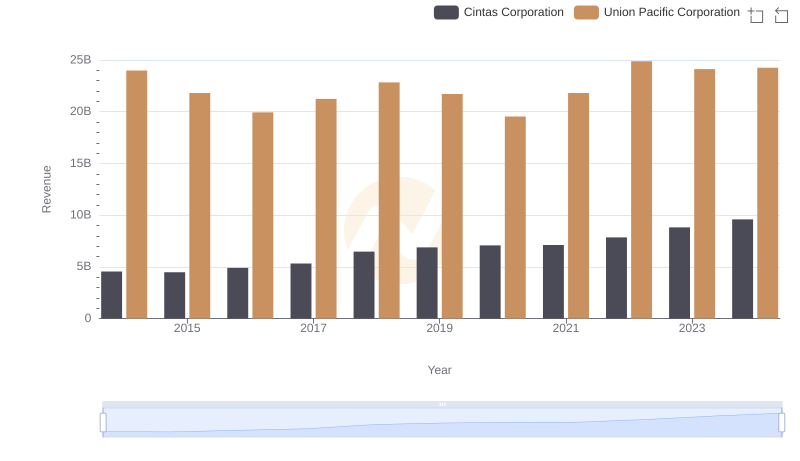
Revenue Insights: Union Pacific Corporation and Cintas Corporation Performance Compared
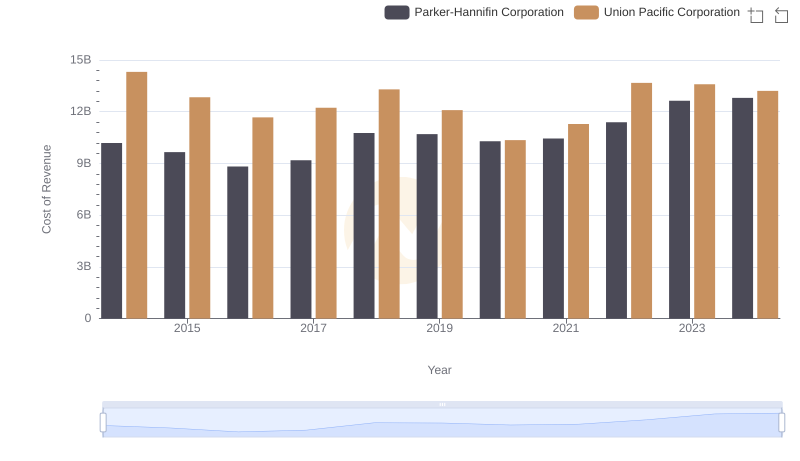
Union Pacific Corporation vs Parker-Hannifin Corporation: Efficiency in Cost of Revenue Explored