| __timestamp | Union Pacific Corporation | United Parcel Service, Inc. |
|---|---|---|
| Wednesday, January 1, 2014 | 23988000000 | 58232000000 |
| Thursday, January 1, 2015 | 21813000000 | 58363000000 |
| Friday, January 1, 2016 | 19941000000 | 60906000000 |
| Sunday, January 1, 2017 | 21240000000 | 65872000000 |
| Monday, January 1, 2018 | 22832000000 | 71861000000 |
| Tuesday, January 1, 2019 | 21708000000 | 74094000000 |
| Wednesday, January 1, 2020 | 19533000000 | 84628000000 |
| Friday, January 1, 2021 | 21804000000 | 97287000000 |
| Saturday, January 1, 2022 | 24875000000 | 100338000000 |
| Sunday, January 1, 2023 | 24119000000 | 90958000000 |
| Monday, January 1, 2024 | 24250000000 | 91070000000 |
Unleashing the power of data
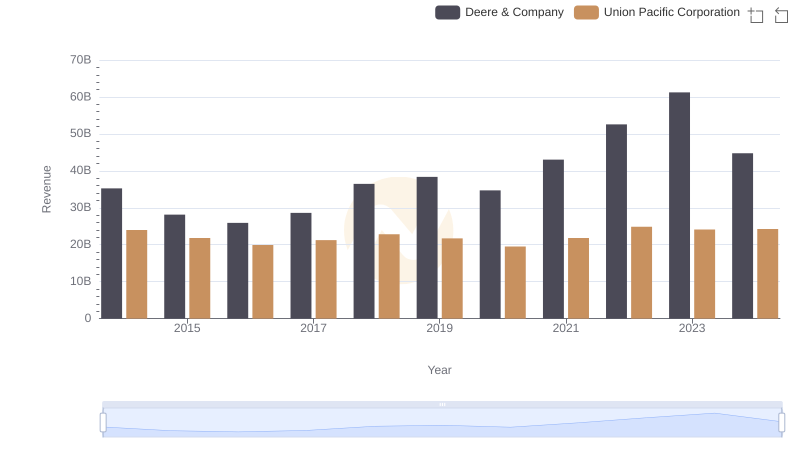
In the ever-evolving landscape of American industry, Union Pacific Corporation and United Parcel Service, Inc. stand as titans of transportation and logistics. Over the past decade, these companies have showcased distinct revenue trajectories. From 2014 to 2023, Union Pacific's revenue fluctuated modestly, peaking in 2022 with a 27% increase from its 2016 low. Meanwhile, UPS demonstrated a robust growth pattern, with revenue surging by 72% from 2014 to 2022, before a slight dip in 2023.
The data reveals a compelling narrative of resilience and adaptation. Union Pacific's steady performance underscores its strategic stability, while UPS's dynamic growth highlights its adaptability in a rapidly changing market. As we look to the future, these trends offer valuable insights into the operational strategies and market positioning of these industry leaders.
Union Pacific Corporation vs Deere & Company: Examining Key Revenue Metrics

Who Generates More Revenue? Union Pacific Corporation or Parker-Hannifin Corporation

Analyzing Cost of Revenue: Union Pacific Corporation and United Parcel Service, Inc.

Gross Profit Comparison: Union Pacific Corporation and United Parcel Service, Inc. Trends