| __timestamp | Clean Harbors, Inc. | The Boeing Company |
|---|---|---|
| Wednesday, January 1, 2014 | 3401636000 | 90762000000 |
| Thursday, January 1, 2015 | 3275137000 | 96114000000 |
| Friday, January 1, 2016 | 2755226000 | 94571000000 |
| Sunday, January 1, 2017 | 2944978000 | 93392000000 |
| Monday, January 1, 2018 | 3300303000 | 101127000000 |
| Tuesday, January 1, 2019 | 3412190000 | 76559000000 |
| Wednesday, January 1, 2020 | 3144097000 | 58158000000 |
| Friday, January 1, 2021 | 3805566000 | 62286000000 |
| Saturday, January 1, 2022 | 5166605000 | 66608000000 |
| Sunday, January 1, 2023 | 5409152000 | 77794000000 |
| Monday, January 1, 2024 | 5889952000 | 66517000000 |
Infusing magic into the data realm
In the ever-evolving landscape of American industry, two companies stand out for their distinct paths: The Boeing Company and Clean Harbors, Inc. Over the past decade, these giants have showcased contrasting revenue trajectories. Boeing, a titan in aerospace, saw its revenue peak in 2018, only to face a significant dip in 2019 and 2020, reflecting a 42% decline from its 2018 high. This downturn coincided with global challenges, including the pandemic's impact on air travel. Meanwhile, Clean Harbors, a leader in environmental services, demonstrated resilience, with revenue growing by 60% from 2014 to 2023. This growth underscores the increasing demand for sustainable solutions. As of 2023, Boeing's revenue rebounded by 34% from its 2020 low, while Clean Harbors continued its upward trend. The data reveals a compelling narrative of adaptation and resilience in two distinct sectors.

The Boeing Company or AECOM: Who Leads in Yearly Revenue?
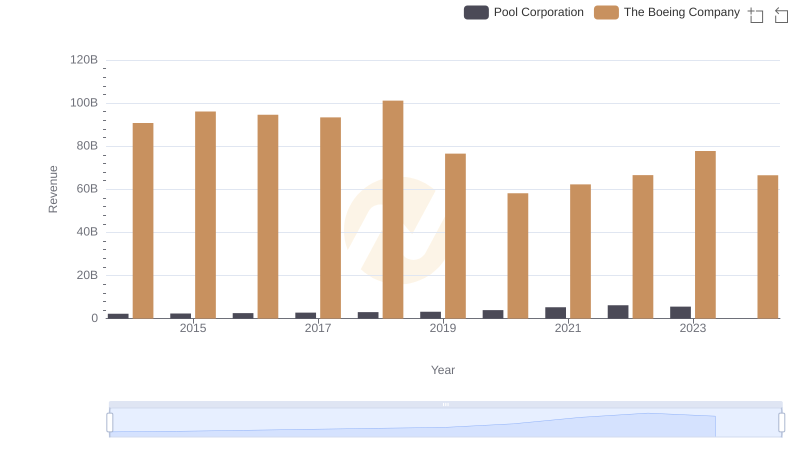
Breaking Down Revenue Trends: The Boeing Company vs Pool Corporation
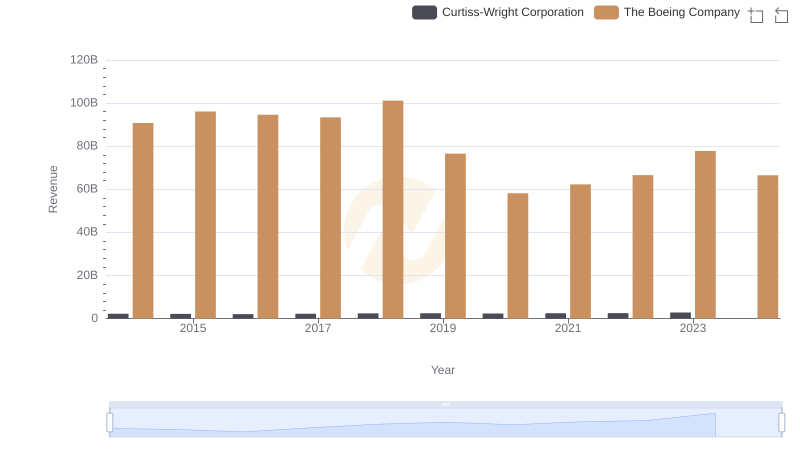
The Boeing Company and Curtiss-Wright Corporation: A Comprehensive Revenue Analysis
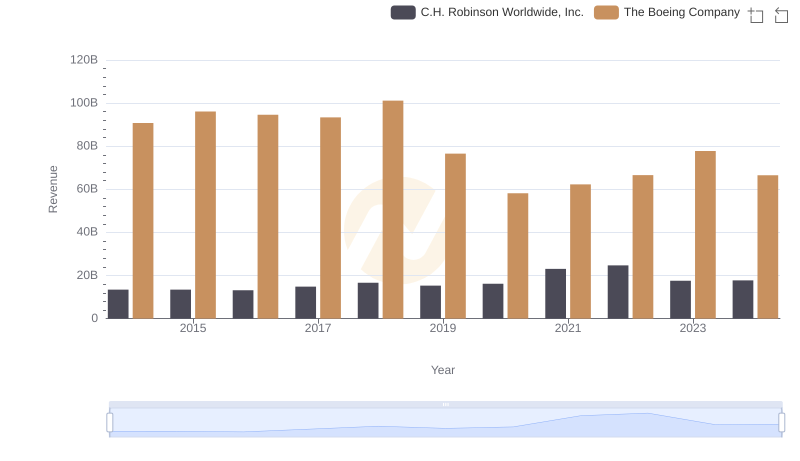
Revenue Insights: The Boeing Company and C.H. Robinson Worldwide, Inc. Performance Compared
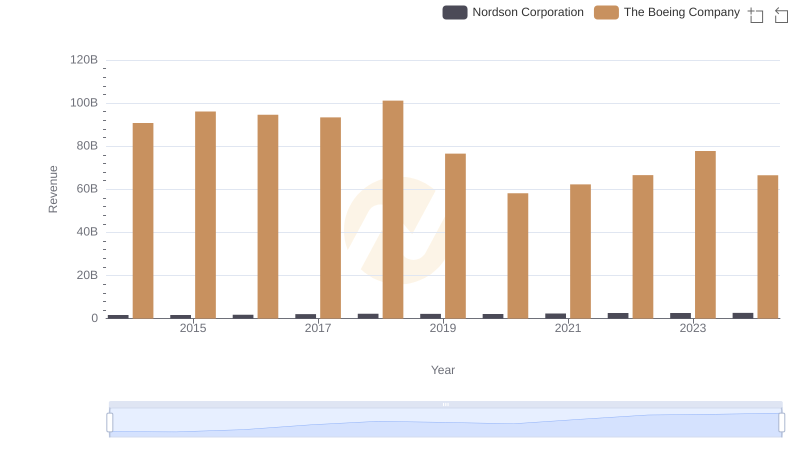
Revenue Insights: The Boeing Company and Nordson Corporation Performance Compared
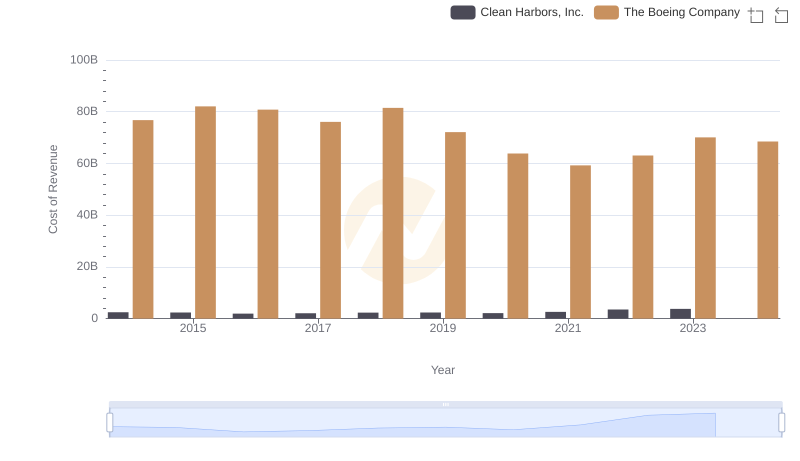
Cost of Revenue Comparison: The Boeing Company vs Clean Harbors, Inc.