| __timestamp | Pool Corporation | The Boeing Company |
|---|---|---|
| Wednesday, January 1, 2014 | 2246562000 | 90762000000 |
| Thursday, January 1, 2015 | 2363139000 | 96114000000 |
| Friday, January 1, 2016 | 2570803000 | 94571000000 |
| Sunday, January 1, 2017 | 2788188000 | 93392000000 |
| Monday, January 1, 2018 | 2998097000 | 101127000000 |
| Tuesday, January 1, 2019 | 3199517000 | 76559000000 |
| Wednesday, January 1, 2020 | 3936623000 | 58158000000 |
| Friday, January 1, 2021 | 5295584000 | 62286000000 |
| Saturday, January 1, 2022 | 6179727000 | 66608000000 |
| Sunday, January 1, 2023 | 5541595000 | 77794000000 |
| Monday, January 1, 2024 | 66517000000 |
Unleashing the power of data
In the ever-evolving landscape of American industry, The Boeing Company and Pool Corporation stand as titans in their respective fields. Over the past decade, Boeing's revenue has seen a rollercoaster ride, peaking in 2018 with a staggering 101 billion dollars, only to dip significantly in 2019 and 2020, reflecting the global challenges faced by the aerospace sector. Meanwhile, Pool Corporation, a leader in the pool supply industry, has demonstrated a steady upward trajectory, with revenues growing by approximately 175% from 2014 to 2022. This growth underscores the increasing demand for leisure and home improvement products. Notably, 2023 saw a slight decline for Pool Corporation, while Boeing showed signs of recovery. The data for 2024 remains incomplete, leaving room for speculation on future trends. This comparison highlights the resilience and adaptability required to thrive in diverse market conditions.
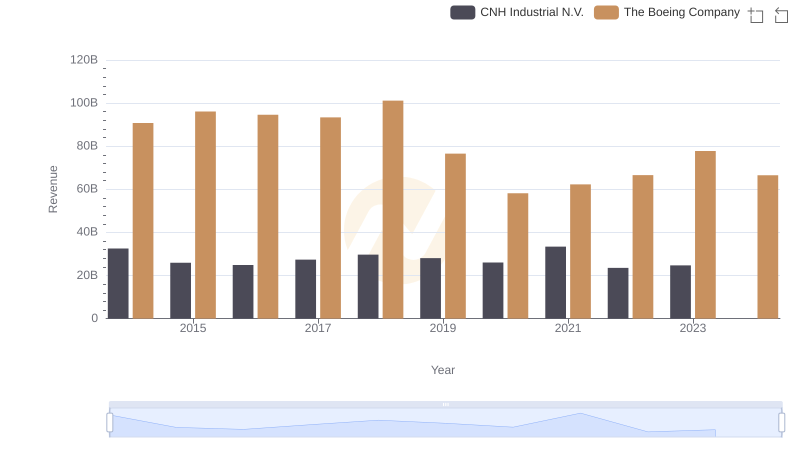
Breaking Down Revenue Trends: The Boeing Company vs CNH Industrial N.V.
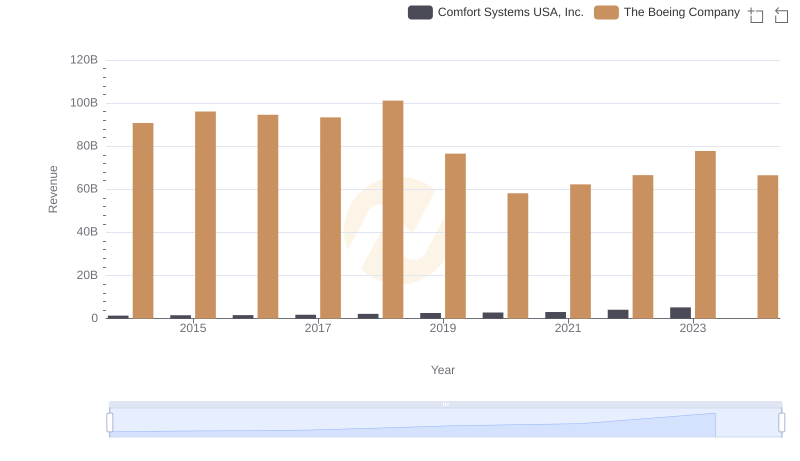
Breaking Down Revenue Trends: The Boeing Company vs Comfort Systems USA, Inc.

The Boeing Company or AECOM: Who Leads in Yearly Revenue?
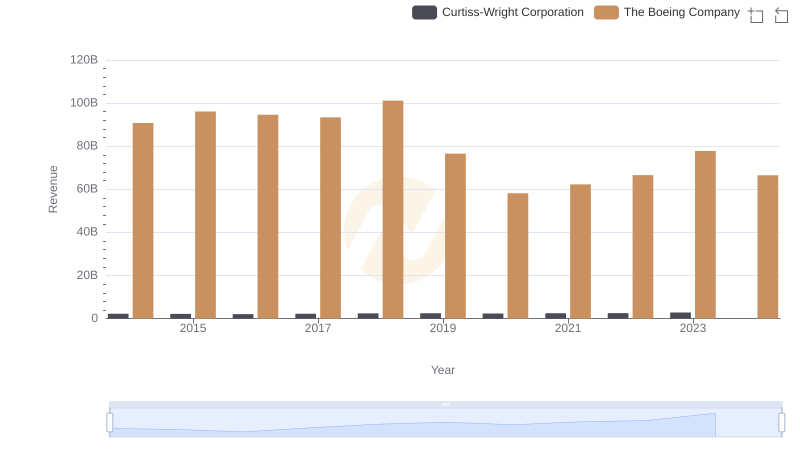
The Boeing Company and Curtiss-Wright Corporation: A Comprehensive Revenue Analysis
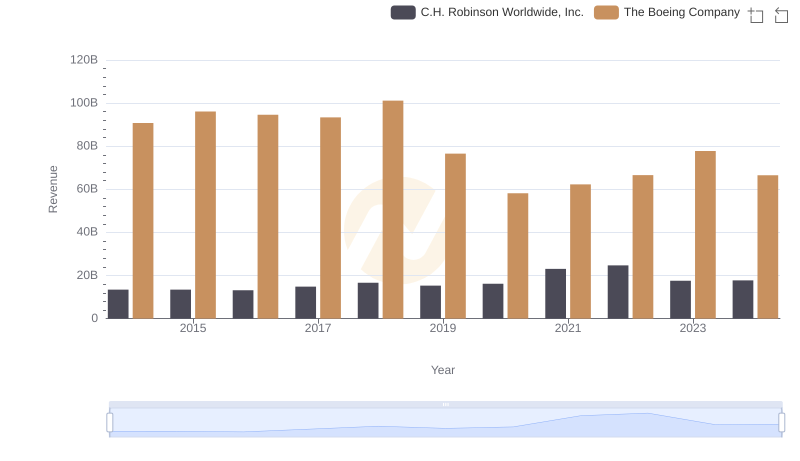
Revenue Insights: The Boeing Company and C.H. Robinson Worldwide, Inc. Performance Compared
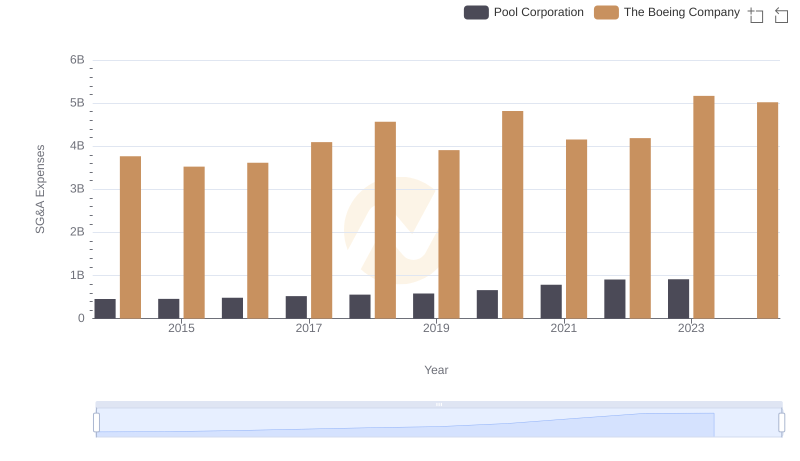
The Boeing Company or Pool Corporation: Who Manages SG&A Costs Better?