| __timestamp | C.H. Robinson Worldwide, Inc. | The Boeing Company |
|---|---|---|
| Wednesday, January 1, 2014 | 13470067000 | 90762000000 |
| Thursday, January 1, 2015 | 13476084000 | 96114000000 |
| Friday, January 1, 2016 | 13144413000 | 94571000000 |
| Sunday, January 1, 2017 | 14869380000 | 93392000000 |
| Monday, January 1, 2018 | 16631172000 | 101127000000 |
| Tuesday, January 1, 2019 | 15309508000 | 76559000000 |
| Wednesday, January 1, 2020 | 16207106000 | 58158000000 |
| Friday, January 1, 2021 | 23102138000 | 62286000000 |
| Saturday, January 1, 2022 | 24696625000 | 66608000000 |
| Sunday, January 1, 2023 | 17596443000 | 77794000000 |
| Monday, January 1, 2024 | 17724956000 | 66517000000 |
Cracking the code
In the ever-evolving landscape of global commerce, understanding the financial trajectories of industry giants like The Boeing Company and C.H. Robinson Worldwide, Inc. offers invaluable insights. Over the past decade, Boeing's revenue has experienced significant fluctuations, peaking in 2018 before a notable decline in 2019 and 2020, likely influenced by global events impacting the aviation sector. Despite this, Boeing's revenue in 2023 shows a promising recovery, reaching approximately 78% of its 2018 peak.
Conversely, C.H. Robinson, a leader in logistics, has demonstrated a more stable revenue growth pattern. From 2014 to 2022, the company saw a steady increase, with a remarkable 47% growth in 2021. However, 2023 marks a slight dip, possibly reflecting market adjustments post-pandemic. This comparative analysis underscores the resilience and adaptability of these companies in navigating economic challenges and opportunities.
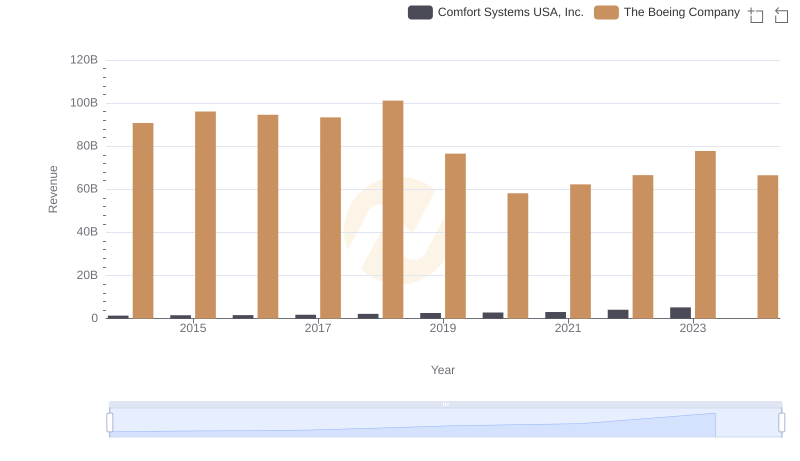
Breaking Down Revenue Trends: The Boeing Company vs Comfort Systems USA, Inc.

The Boeing Company or AECOM: Who Leads in Yearly Revenue?
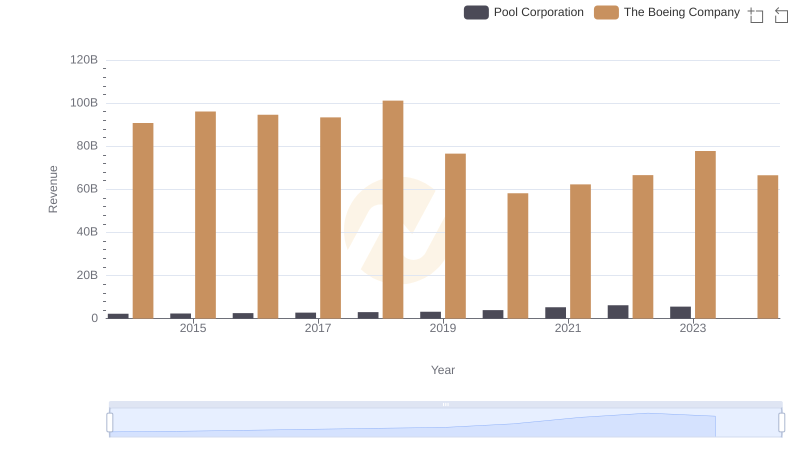
Breaking Down Revenue Trends: The Boeing Company vs Pool Corporation
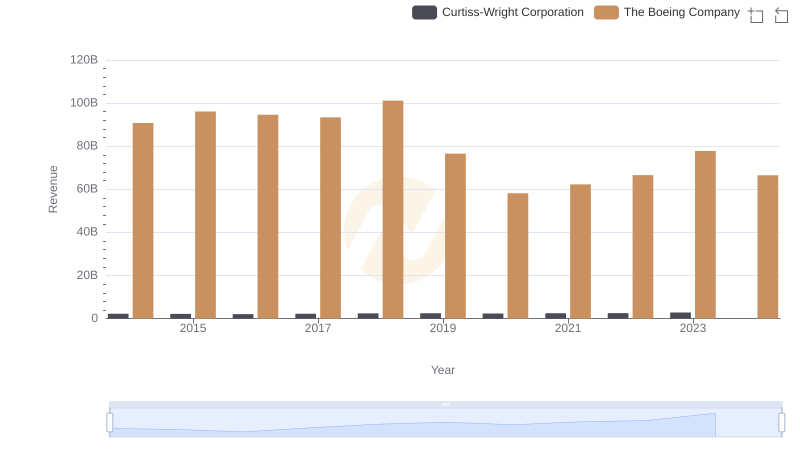
The Boeing Company and Curtiss-Wright Corporation: A Comprehensive Revenue Analysis
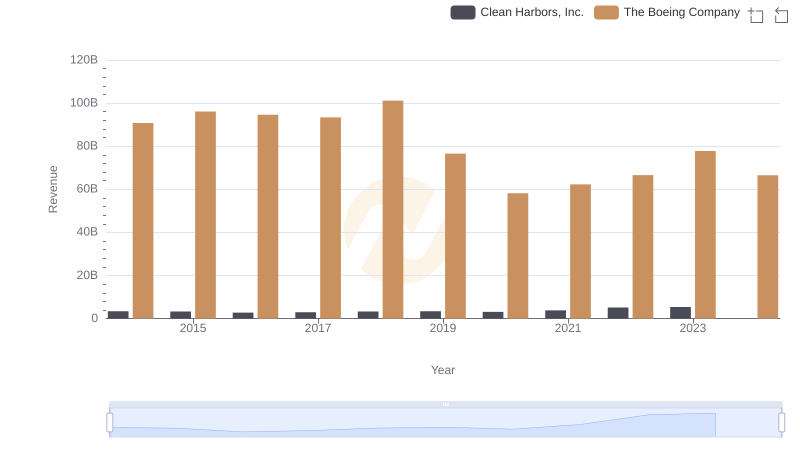
Comparing Revenue Performance: The Boeing Company or Clean Harbors, Inc.?
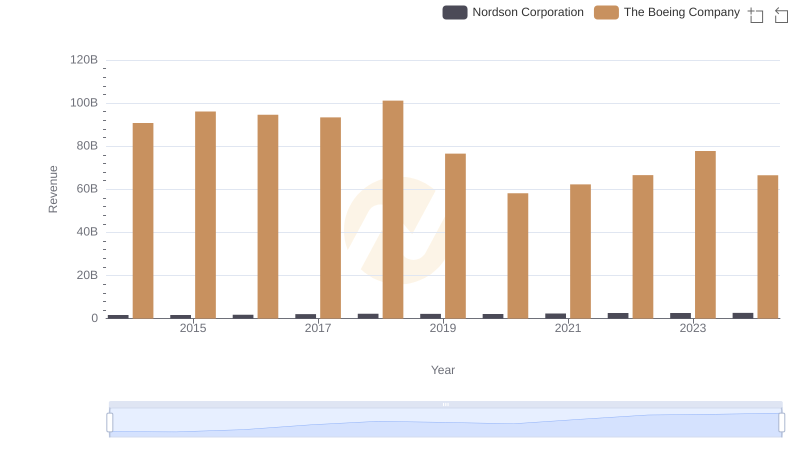
Revenue Insights: The Boeing Company and Nordson Corporation Performance Compared
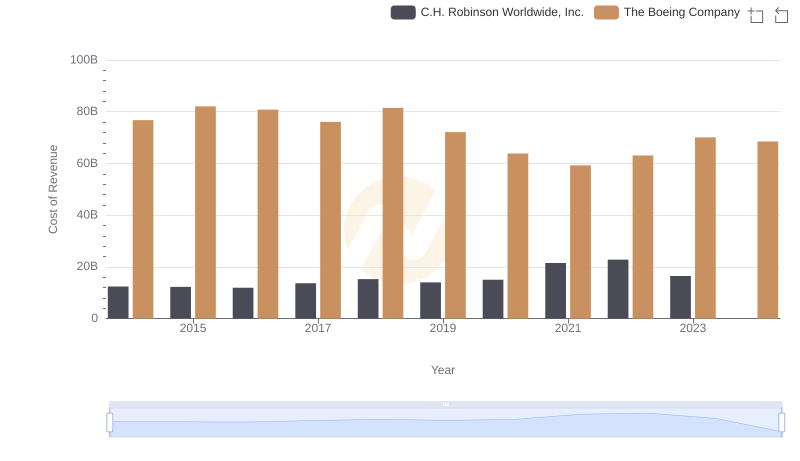
Cost Insights: Breaking Down The Boeing Company and C.H. Robinson Worldwide, Inc.'s Expenses