| __timestamp | Guidewire Software, Inc. | QUALCOMM Incorporated |
|---|---|---|
| Wednesday, January 1, 2014 | 350246000 | 26487000000 |
| Thursday, January 1, 2015 | 380537000 | 25281000000 |
| Friday, January 1, 2016 | 424446000 | 23554000000 |
| Sunday, January 1, 2017 | 514284000 | 22291000000 |
| Monday, January 1, 2018 | 661067000 | 22732000000 |
| Tuesday, January 1, 2019 | 719514000 | 24273000000 |
| Wednesday, January 1, 2020 | 742307000 | 23531000000 |
| Friday, January 1, 2021 | 743267000 | 33566000000 |
| Saturday, January 1, 2022 | 812614000 | 44200000000 |
| Sunday, January 1, 2023 | 905341000 | 35820000000 |
| Monday, January 1, 2024 | 980497000 | 38962000000 |
Infusing magic into the data realm
In the ever-evolving landscape of technology, revenue growth is a key indicator of a company's success. Over the past decade, QUALCOMM Incorporated and Guidewire Software, Inc. have showcased contrasting revenue trajectories. From 2014 to 2024, QUALCOMM's revenue has consistently outpaced Guidewire's, with a staggering 1,370% higher average revenue. QUALCOMM's peak in 2022, with a revenue of approximately $44.2 billion, highlights its dominance in the semiconductor industry. Meanwhile, Guidewire, a leader in software solutions for the insurance sector, has shown steady growth, reaching nearly $980 million in 2024, marking a 180% increase since 2014. This comparison underscores the diverse growth strategies and market dynamics influencing these two tech titans. As we look to the future, understanding these trends provides valuable insights into the competitive landscape of the technology sector.
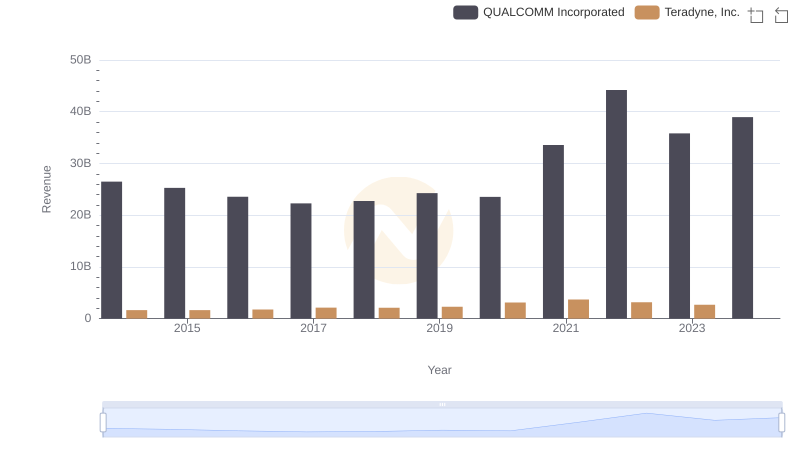
Revenue Showdown: QUALCOMM Incorporated vs Teradyne, Inc.
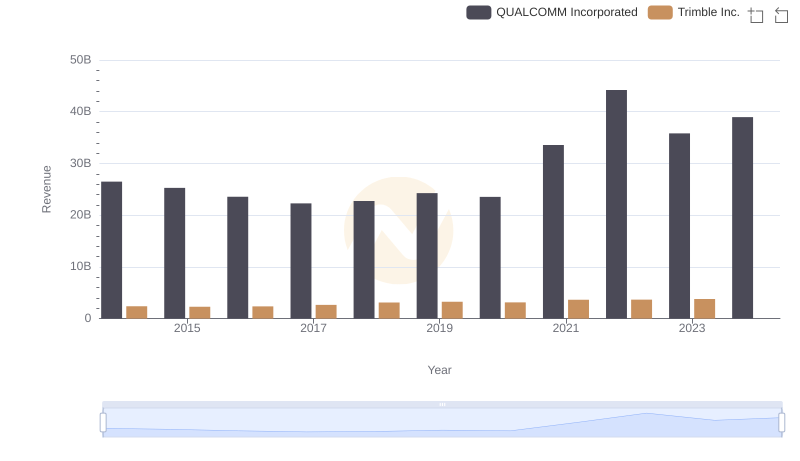
Revenue Insights: QUALCOMM Incorporated and Trimble Inc. Performance Compared
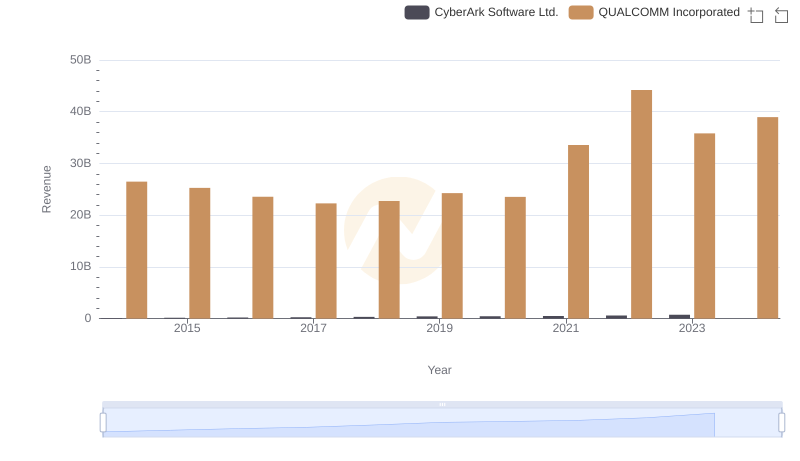
QUALCOMM Incorporated vs CyberArk Software Ltd.: Annual Revenue Growth Compared
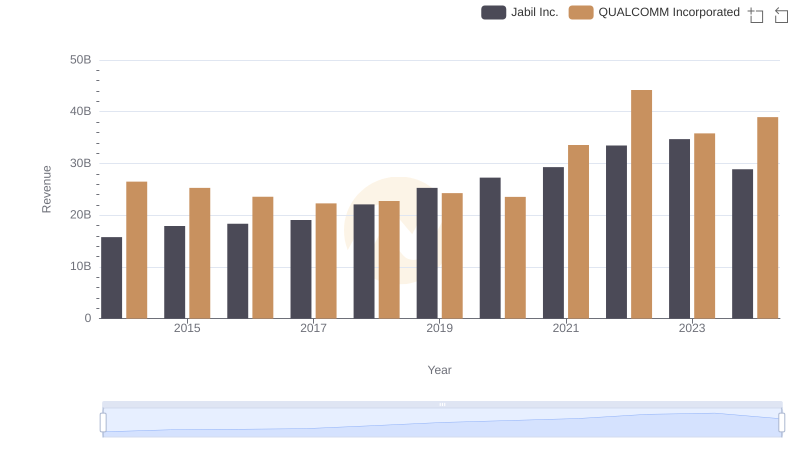
Breaking Down Revenue Trends: QUALCOMM Incorporated vs Jabil Inc.
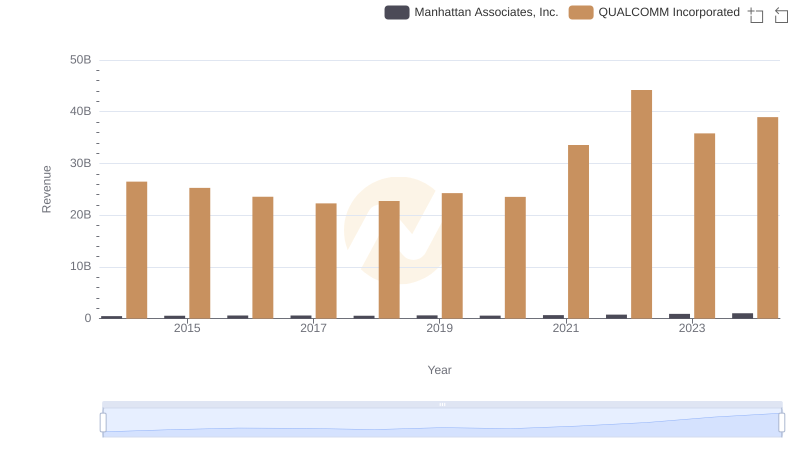
Who Generates More Revenue? QUALCOMM Incorporated or Manhattan Associates, Inc.
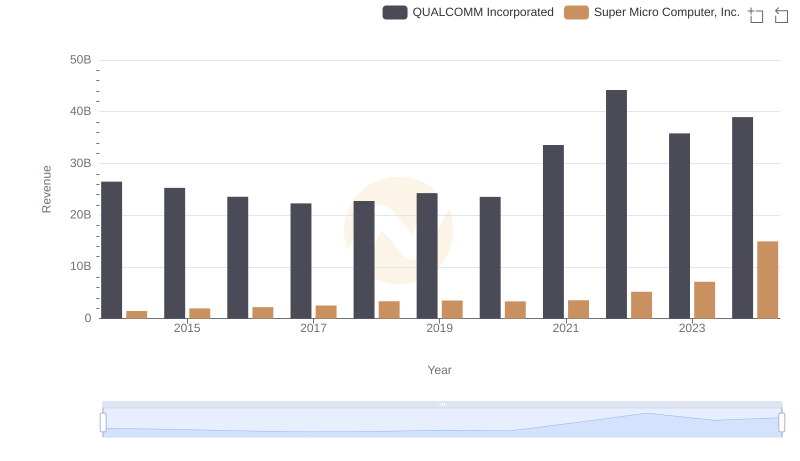
Revenue Insights: QUALCOMM Incorporated and Super Micro Computer, Inc. Performance Compared
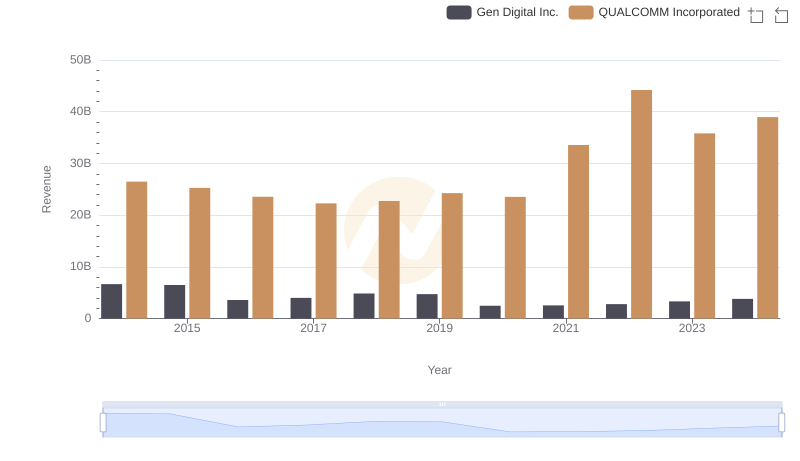
QUALCOMM Incorporated and Gen Digital Inc.: A Comprehensive Revenue Analysis
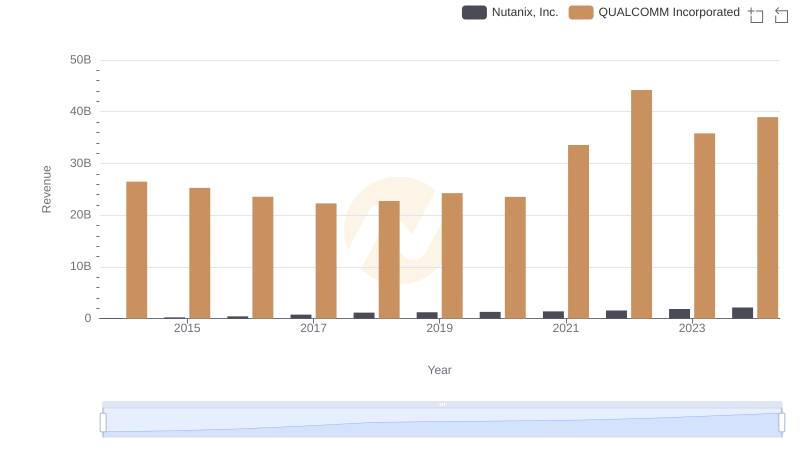
QUALCOMM Incorporated or Nutanix, Inc.: Who Leads in Yearly Revenue?
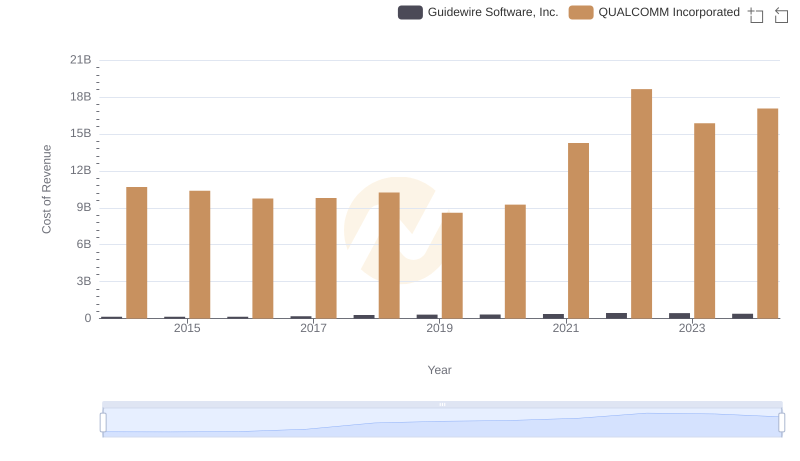
Cost of Revenue Trends: QUALCOMM Incorporated vs Guidewire Software, Inc.
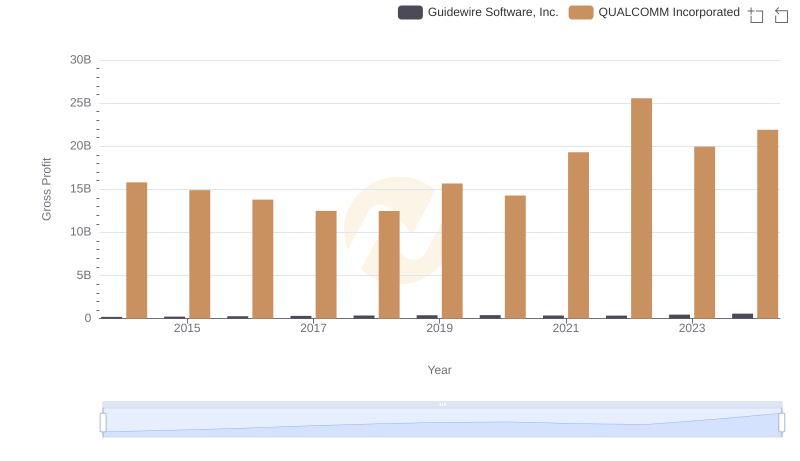
QUALCOMM Incorporated vs Guidewire Software, Inc.: A Gross Profit Performance Breakdown
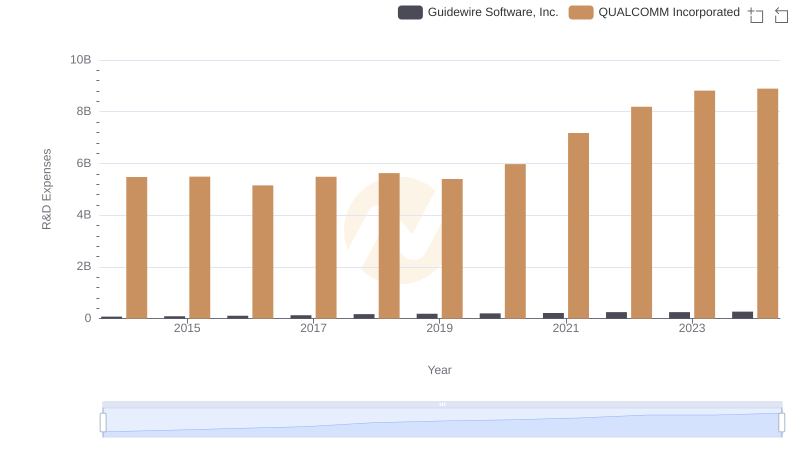
R&D Spending Showdown: QUALCOMM Incorporated vs Guidewire Software, Inc.
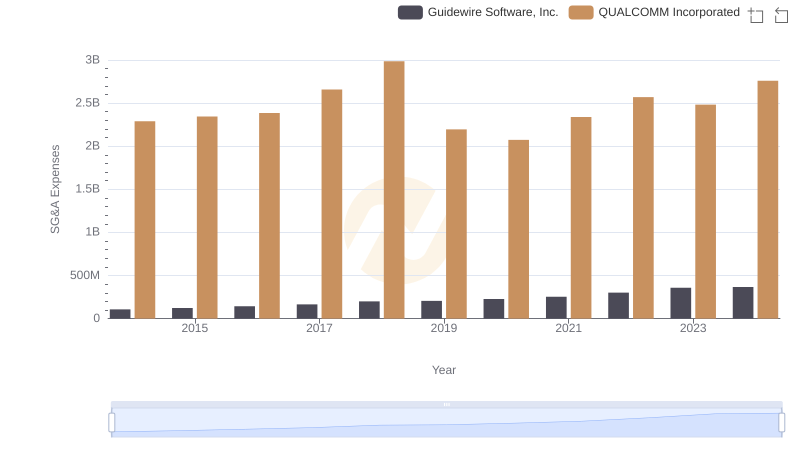
QUALCOMM Incorporated or Guidewire Software, Inc.: Who Manages SG&A Costs Better?