| __timestamp | Automatic Data Processing, Inc. | Waste Connections, Inc. |
|---|---|---|
| Wednesday, January 1, 2014 | 2616900000 | 717805000 |
| Thursday, January 1, 2015 | 2355100000 | 191002871 |
| Friday, January 1, 2016 | 2579500000 | 900371894 |
| Sunday, January 1, 2017 | 2927200000 | 1380632000 |
| Monday, January 1, 2018 | 2762900000 | 1442229014 |
| Tuesday, January 1, 2019 | 3544500000 | 1650754605 |
| Wednesday, January 1, 2020 | 3769700000 | 1597555000 |
| Friday, January 1, 2021 | 3931600000 | 1891001000 |
| Saturday, January 1, 2022 | 4405500000 | 2090554149 |
| Sunday, January 1, 2023 | 5244600000 | 2261354000 |
| Monday, January 1, 2024 | 5800000000 | 2389779000 |
Data in motion
In the ever-evolving landscape of corporate finance, EBITDA serves as a crucial metric for evaluating a company's operational performance. Over the past decade, Automatic Data Processing, Inc. (ADP) and Waste Connections, Inc. have demonstrated contrasting trajectories in their EBITDA growth.
From 2014 to 2023, ADP's EBITDA surged by approximately 122%, reflecting its robust business model and strategic initiatives. In contrast, Waste Connections, Inc. experienced a more modest growth of around 215% over the same period, showcasing its steady expansion in the waste management sector.
Interestingly, ADP's EBITDA consistently outpaced Waste Connections, with a peak in 2024, although data for Waste Connections in 2024 remains unavailable. This comparison highlights the diverse growth strategies and market dynamics influencing these industry leaders. As we look to the future, these trends offer valuable insights for investors and stakeholders alike.
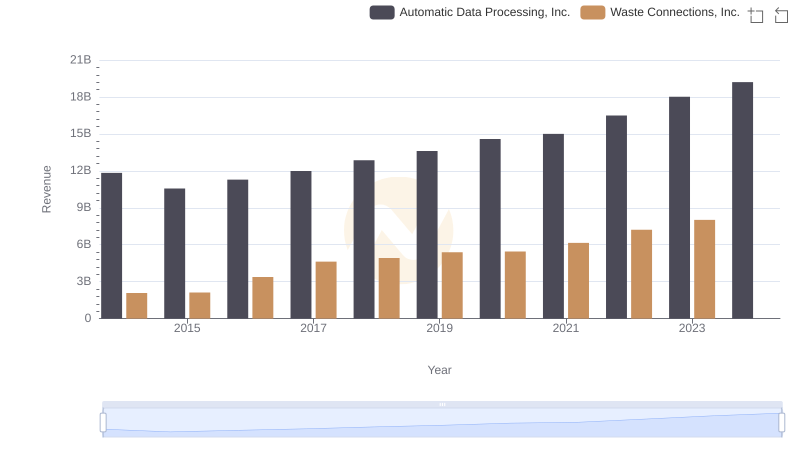
Annual Revenue Comparison: Automatic Data Processing, Inc. vs Waste Connections, Inc.
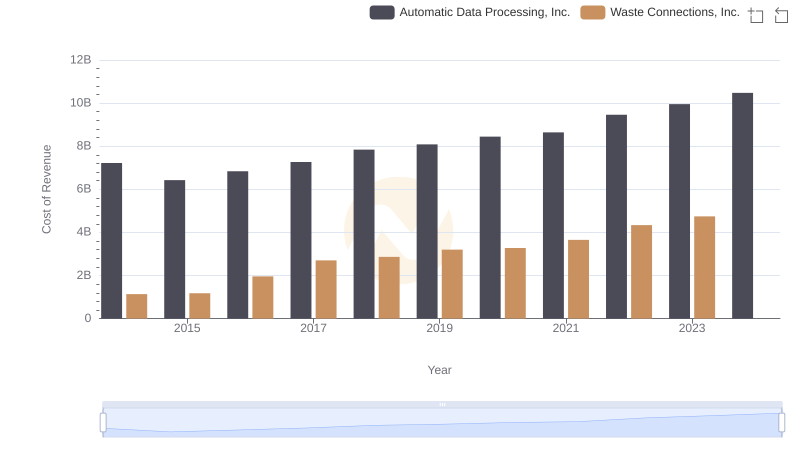
Cost Insights: Breaking Down Automatic Data Processing, Inc. and Waste Connections, Inc.'s Expenses
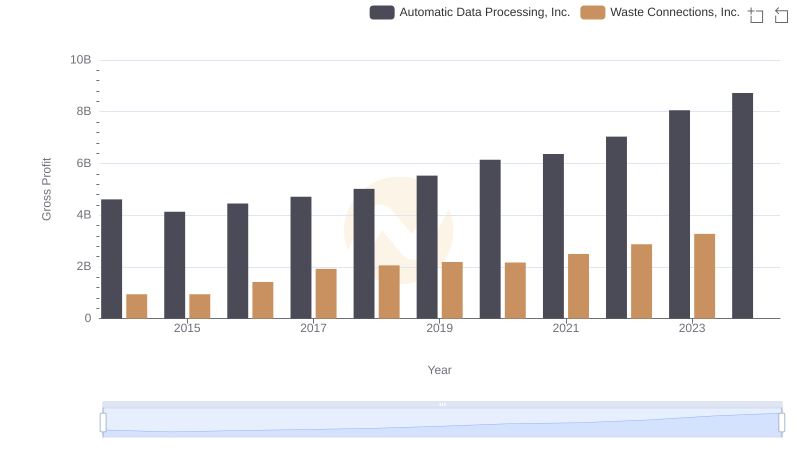
Automatic Data Processing, Inc. and Waste Connections, Inc.: A Detailed Gross Profit Analysis
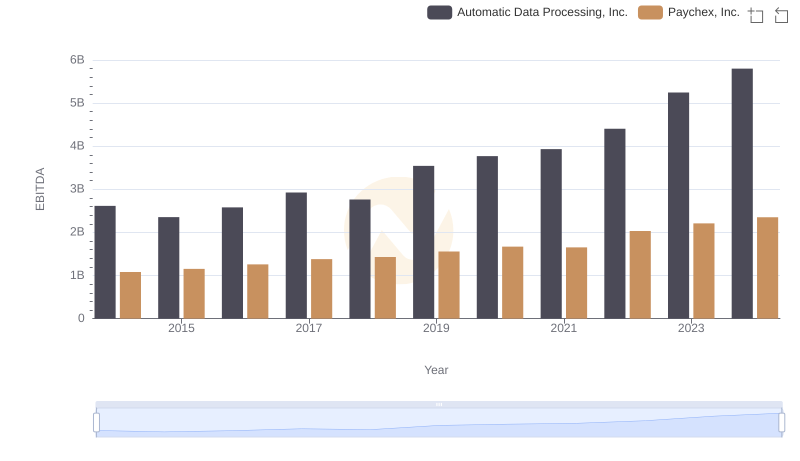
Comprehensive EBITDA Comparison: Automatic Data Processing, Inc. vs Paychex, Inc.
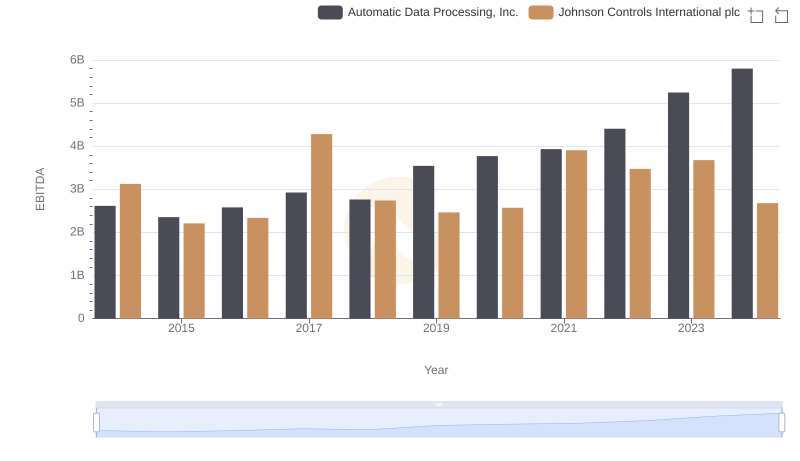
Comprehensive EBITDA Comparison: Automatic Data Processing, Inc. vs Johnson Controls International plc
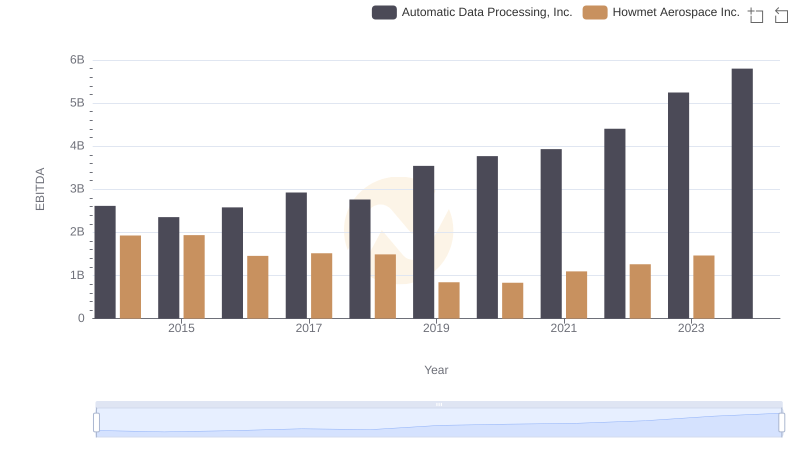
Comparative EBITDA Analysis: Automatic Data Processing, Inc. vs Howmet Aerospace Inc.
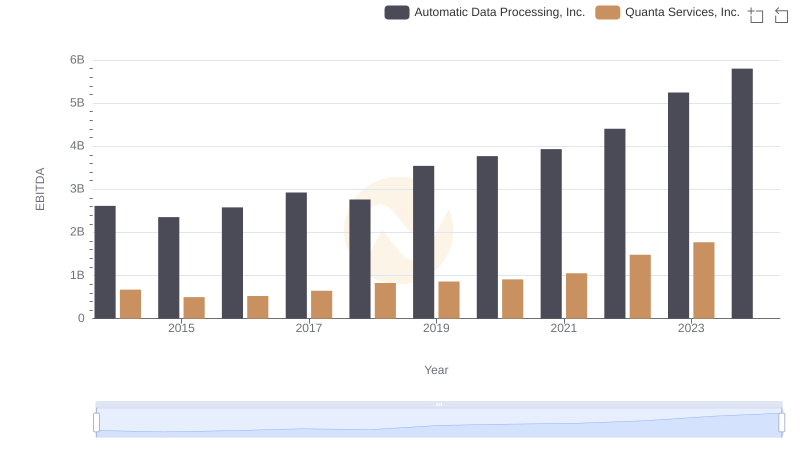
Automatic Data Processing, Inc. vs Quanta Services, Inc.: In-Depth EBITDA Performance Comparison