| __timestamp | Automatic Data Processing, Inc. | Waste Connections, Inc. |
|---|---|---|
| Wednesday, January 1, 2014 | 4611400000 | 940778000 |
| Thursday, January 1, 2015 | 4133200000 | 939878000 |
| Friday, January 1, 2016 | 4450200000 | 1418151000 |
| Sunday, January 1, 2017 | 4712600000 | 1925713000 |
| Monday, January 1, 2018 | 5016700000 | 2057237000 |
| Tuesday, January 1, 2019 | 5526700000 | 2189922000 |
| Wednesday, January 1, 2020 | 6144700000 | 2169182000 |
| Friday, January 1, 2021 | 6365100000 | 2497287000 |
| Saturday, January 1, 2022 | 7036400000 | 2875847000 |
| Sunday, January 1, 2023 | 8058800000 | 3277438000 |
| Monday, January 1, 2024 | 8725900000 | 3727885000 |
Unleashing insights
In the ever-evolving landscape of corporate finance, understanding the trajectory of gross profits is crucial. From 2014 to 2023, Automatic Data Processing, Inc. (ADP) and Waste Connections, Inc. have shown distinct financial paths. ADP's gross profit surged by approximately 89%, reflecting its robust growth and market adaptability. In contrast, Waste Connections, Inc. experienced a remarkable 248% increase, showcasing its aggressive expansion strategy in the waste management sector. Notably, ADP's gross profit consistently outpaced Waste Connections, highlighting its dominant position in the payroll and human resources industry. However, the absence of data for Waste Connections in 2024 suggests potential reporting delays or strategic shifts. This analysis underscores the importance of monitoring financial health and strategic decisions in shaping a company's future.
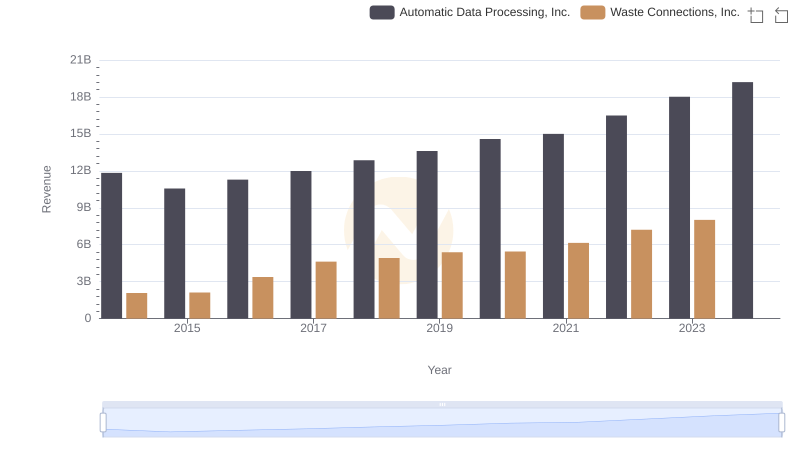
Annual Revenue Comparison: Automatic Data Processing, Inc. vs Waste Connections, Inc.
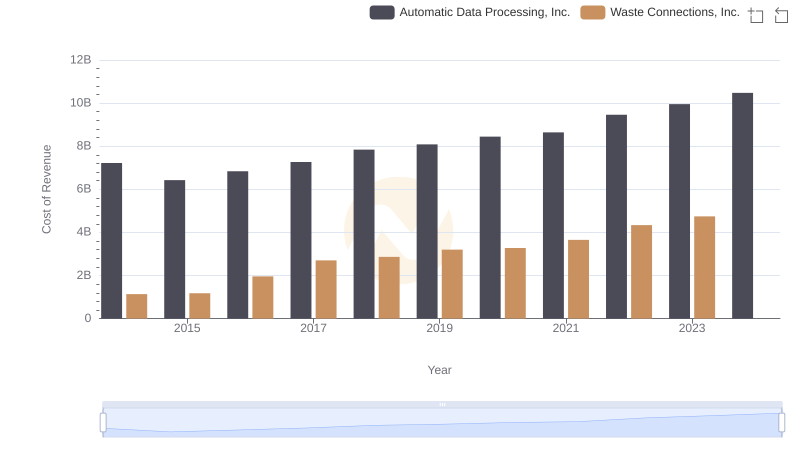
Cost Insights: Breaking Down Automatic Data Processing, Inc. and Waste Connections, Inc.'s Expenses
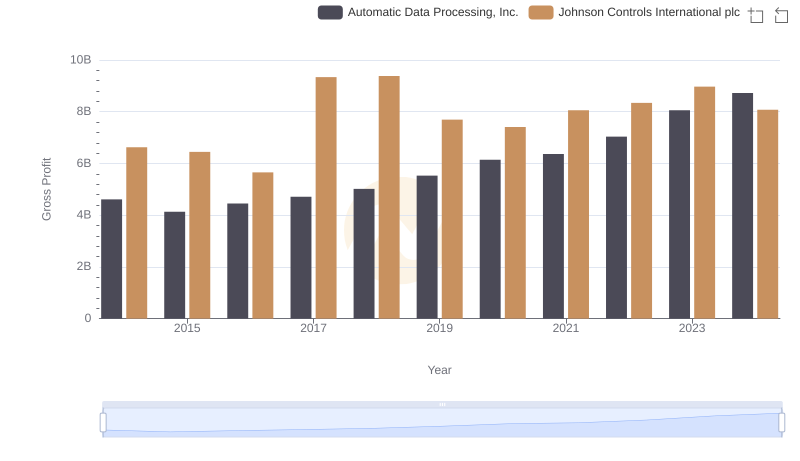
Automatic Data Processing, Inc. vs Johnson Controls International plc: A Gross Profit Performance Breakdown
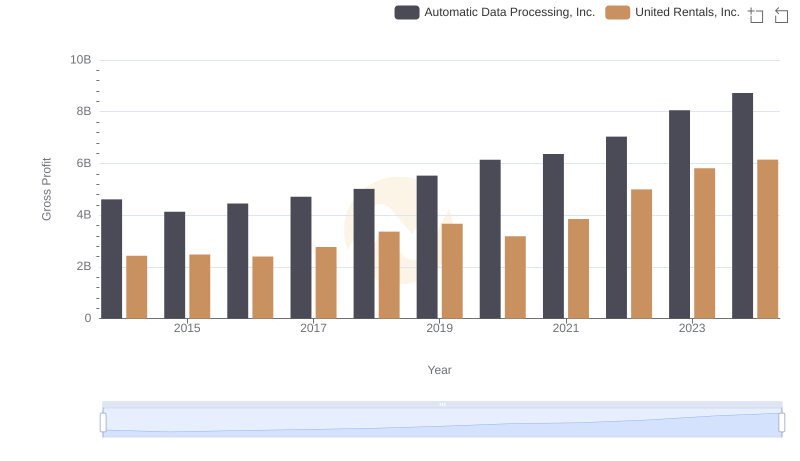
Who Generates Higher Gross Profit? Automatic Data Processing, Inc. or United Rentals, Inc.
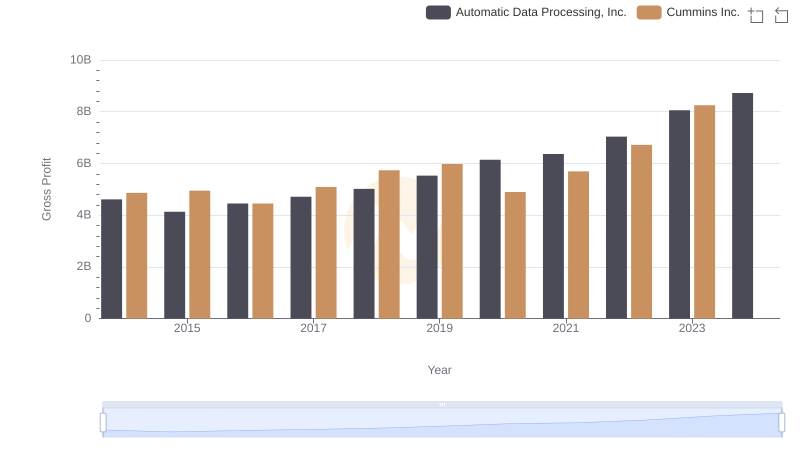
Automatic Data Processing, Inc. and Cummins Inc.: A Detailed Gross Profit Analysis
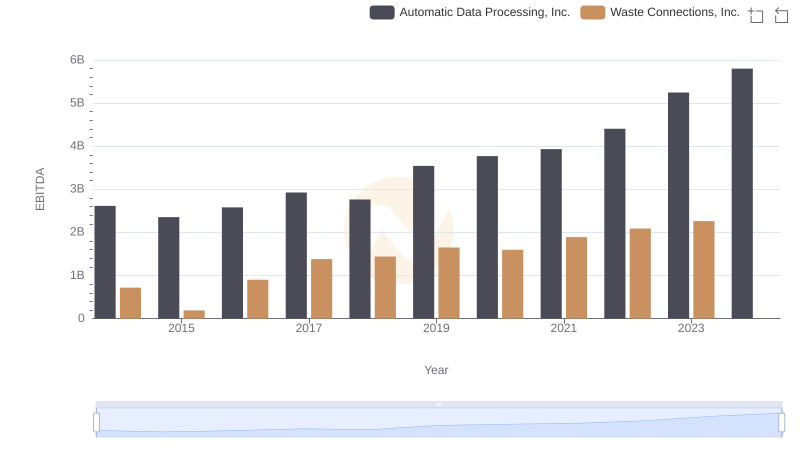
Professional EBITDA Benchmarking: Automatic Data Processing, Inc. vs Waste Connections, Inc.