| __timestamp | Automatic Data Processing, Inc. | Howmet Aerospace Inc. |
|---|---|---|
| Wednesday, January 1, 2014 | 2616900000 | 1927000000 |
| Thursday, January 1, 2015 | 2355100000 | 1936000000 |
| Friday, January 1, 2016 | 2579500000 | 1457000000 |
| Sunday, January 1, 2017 | 2927200000 | 1517000000 |
| Monday, January 1, 2018 | 2762900000 | 1491000000 |
| Tuesday, January 1, 2019 | 3544500000 | 843000000 |
| Wednesday, January 1, 2020 | 3769700000 | 831000000 |
| Friday, January 1, 2021 | 3931600000 | 1095000000 |
| Saturday, January 1, 2022 | 4405500000 | 1260000000 |
| Sunday, January 1, 2023 | 5244600000 | 1465000000 |
| Monday, January 1, 2024 | 5800000000 | 1842000000 |
In pursuit of knowledge
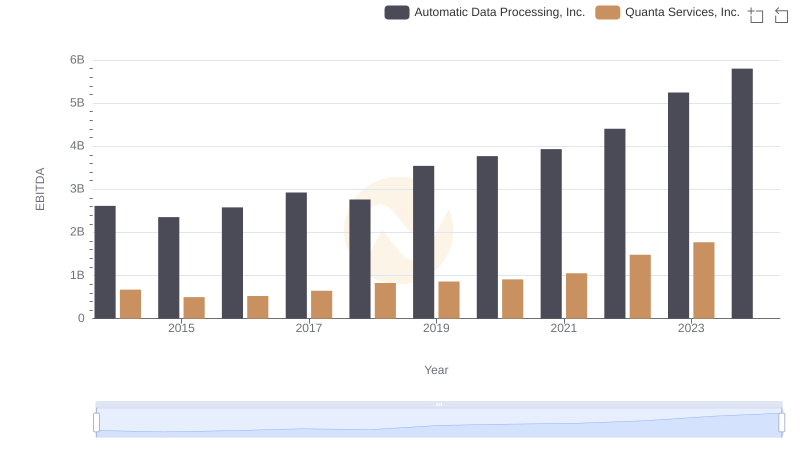
In the ever-evolving landscape of corporate finance, EBITDA serves as a crucial metric for evaluating a company's operational performance. Over the past decade, Automatic Data Processing, Inc. (ADP) has demonstrated a robust growth trajectory, with its EBITDA increasing by approximately 122% from 2014 to 2023. In contrast, Howmet Aerospace Inc. has experienced a more modest growth of around 24% over the same period.
ADP's EBITDA surged from 2.6 billion in 2014 to an impressive 5.2 billion in 2023, reflecting its strategic initiatives and market adaptability. Meanwhile, Howmet Aerospace faced challenges, with its EBITDA peaking at 1.9 billion in 2015 before stabilizing around 1.5 billion in recent years. Notably, data for Howmet Aerospace in 2024 is unavailable, indicating potential reporting delays or strategic shifts.
This comparative analysis underscores the dynamic nature of these industries and highlights ADP's consistent upward momentum.
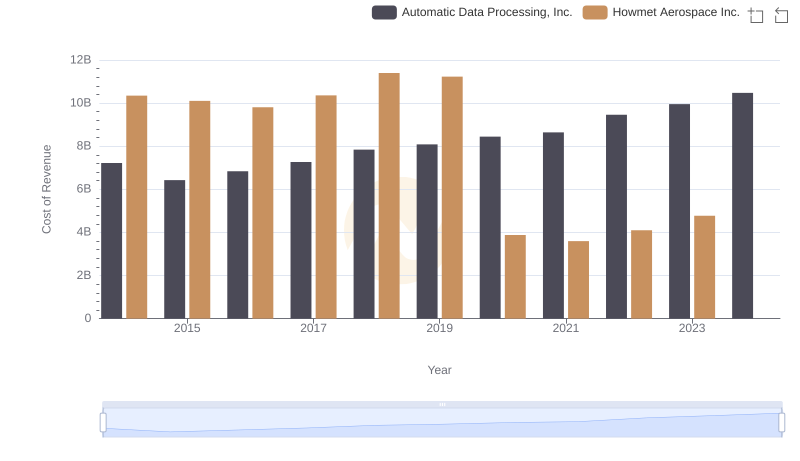
Analyzing Cost of Revenue: Automatic Data Processing, Inc. and Howmet Aerospace Inc.
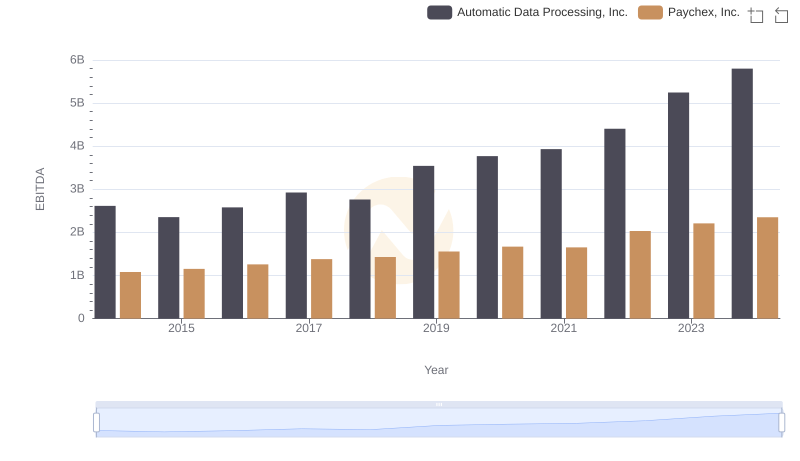
Comprehensive EBITDA Comparison: Automatic Data Processing, Inc. vs Paychex, Inc.
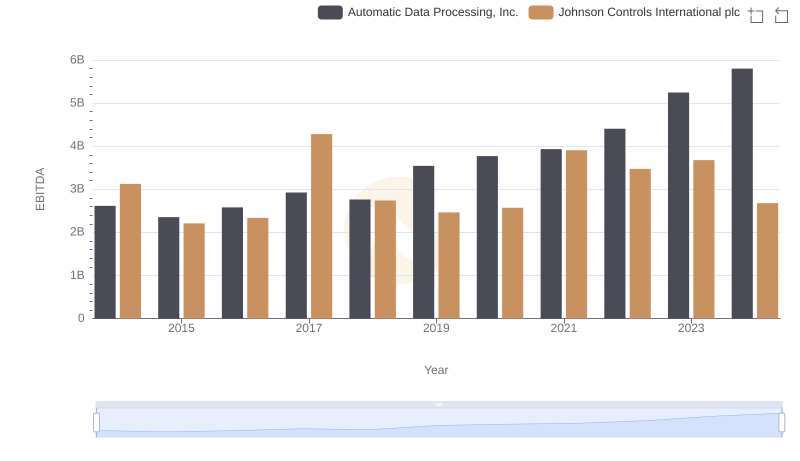
Comprehensive EBITDA Comparison: Automatic Data Processing, Inc. vs Johnson Controls International plc
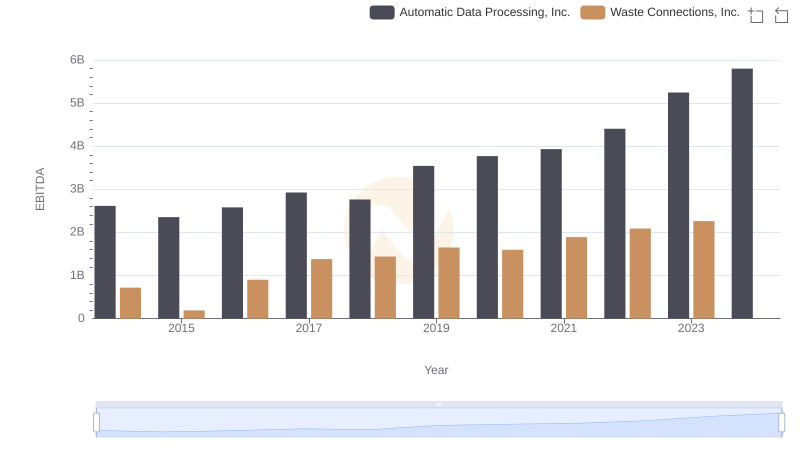
Professional EBITDA Benchmarking: Automatic Data Processing, Inc. vs Waste Connections, Inc.
Automatic Data Processing, Inc. vs Quanta Services, Inc.: In-Depth EBITDA Performance Comparison