| __timestamp | Automatic Data Processing, Inc. | Quanta Services, Inc. |
|---|---|---|
| Wednesday, January 1, 2014 | 2616900000 | 671899000 |
| Thursday, January 1, 2015 | 2355100000 | 497247000 |
| Friday, January 1, 2016 | 2579500000 | 524498000 |
| Sunday, January 1, 2017 | 2927200000 | 647748000 |
| Monday, January 1, 2018 | 2762900000 | 824909000 |
| Tuesday, January 1, 2019 | 3544500000 | 862368000 |
| Wednesday, January 1, 2020 | 3769700000 | 911029000 |
| Friday, January 1, 2021 | 3931600000 | 1052832000 |
| Saturday, January 1, 2022 | 4405500000 | 1483091000 |
| Sunday, January 1, 2023 | 5244600000 | 1770669000 |
| Monday, January 1, 2024 | 5800000000 |
Igniting the spark of knowledge
In the ever-evolving landscape of corporate finance, EBITDA serves as a crucial indicator of a company's operational efficiency. From 2014 to 2023, Automatic Data Processing, Inc. (ADP) and Quanta Services, Inc. have showcased contrasting trajectories in their EBITDA performance. ADP, a leader in human resources management, has seen its EBITDA grow by approximately 122%, from 2.6 billion in 2014 to an impressive 5.8 billion in 2023. This growth underscores ADP's robust business model and strategic adaptability.
Conversely, Quanta Services, a key player in the infrastructure sector, has experienced a more modest EBITDA increase of around 163%, rising from 672 million in 2014 to 1.77 billion in 2023. Despite missing data for 2024, Quanta's steady climb reflects its resilience in a competitive market. This comparison highlights the diverse strategies and market conditions influencing these industry titans.
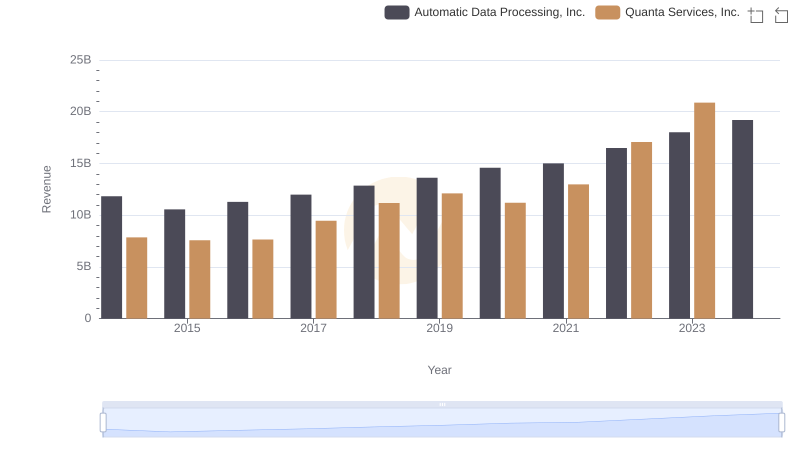
Automatic Data Processing, Inc. vs Quanta Services, Inc.: Examining Key Revenue Metrics
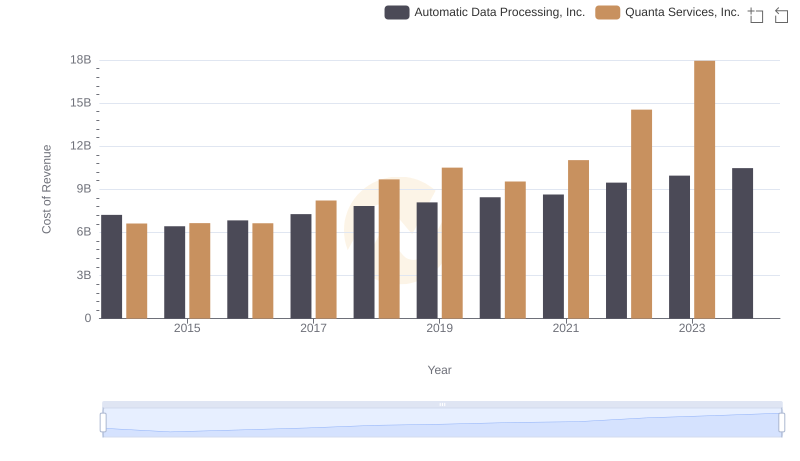
Analyzing Cost of Revenue: Automatic Data Processing, Inc. and Quanta Services, Inc.
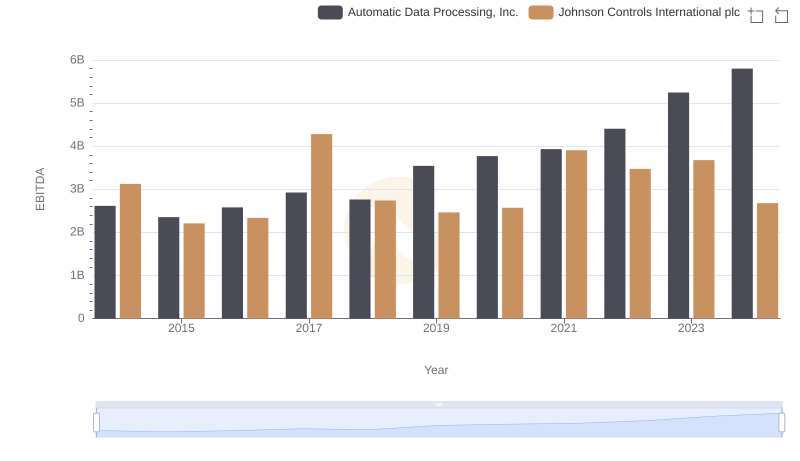
Comprehensive EBITDA Comparison: Automatic Data Processing, Inc. vs Johnson Controls International plc
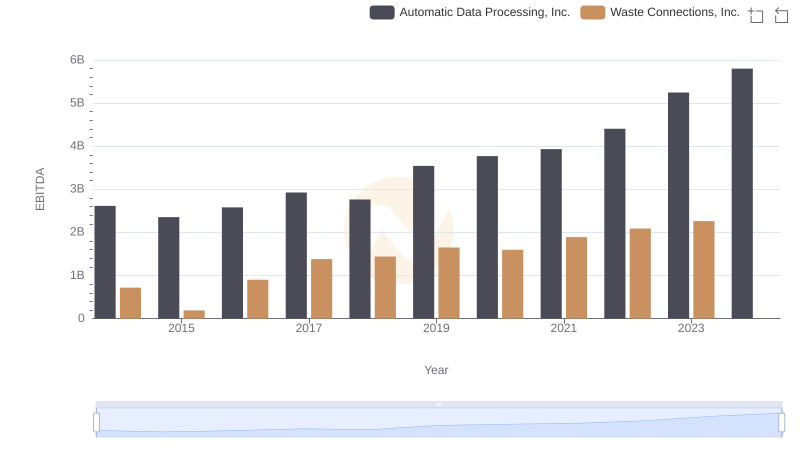
Professional EBITDA Benchmarking: Automatic Data Processing, Inc. vs Waste Connections, Inc.
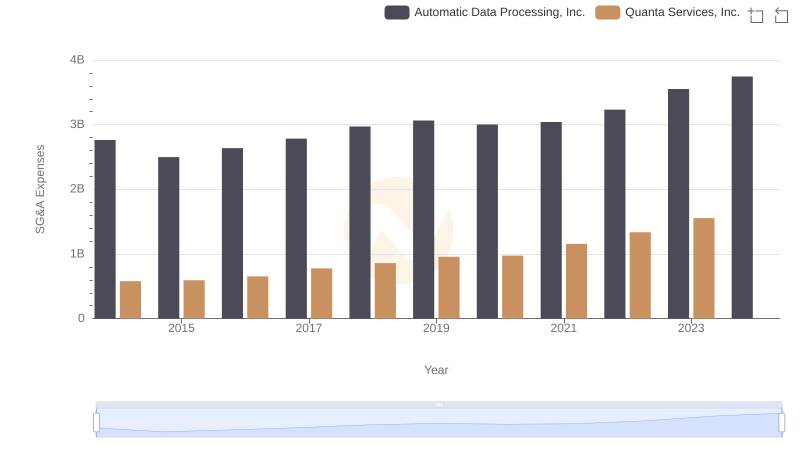
Selling, General, and Administrative Costs: Automatic Data Processing, Inc. vs Quanta Services, Inc.
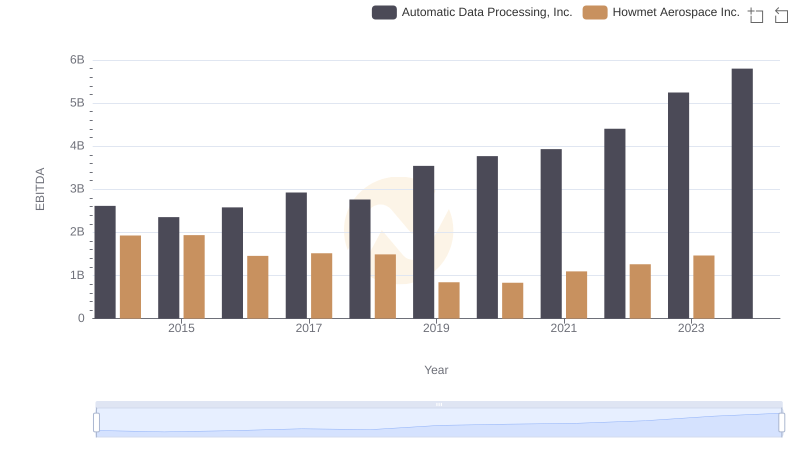
Comparative EBITDA Analysis: Automatic Data Processing, Inc. vs Howmet Aerospace Inc.
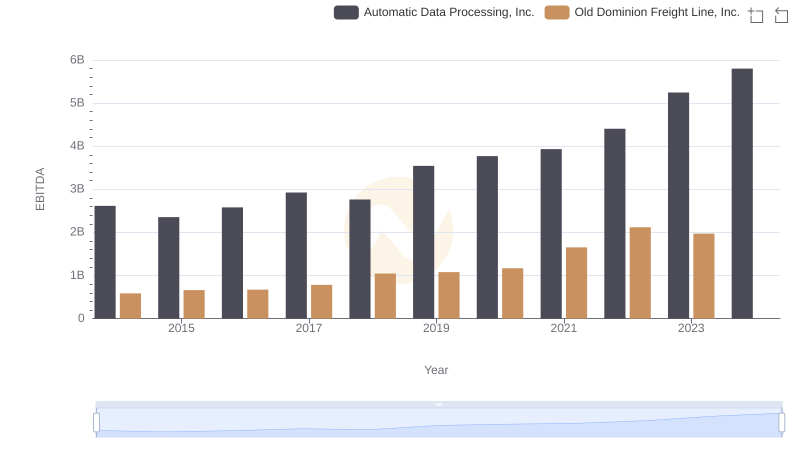
Comprehensive EBITDA Comparison: Automatic Data Processing, Inc. vs Old Dominion Freight Line, Inc.