| __timestamp | Automatic Data Processing, Inc. | Waste Connections, Inc. |
|---|---|---|
| Wednesday, January 1, 2014 | 7221400000 | 1138388000 |
| Thursday, January 1, 2015 | 6427600000 | 1177409000 |
| Friday, January 1, 2016 | 6840300000 | 1957712000 |
| Sunday, January 1, 2017 | 7269800000 | 2704775000 |
| Monday, January 1, 2018 | 7842600000 | 2865704000 |
| Tuesday, January 1, 2019 | 8086600000 | 3198757000 |
| Wednesday, January 1, 2020 | 8445100000 | 3276808000 |
| Friday, January 1, 2021 | 8640300000 | 3654074000 |
| Saturday, January 1, 2022 | 9461900000 | 4336012000 |
| Sunday, January 1, 2023 | 9953400000 | 4744513000 |
| Monday, January 1, 2024 | 10476700000 | 5191706000 |
In pursuit of knowledge
In the ever-evolving landscape of corporate finance, understanding cost structures is pivotal. Automatic Data Processing, Inc. (ADP) and Waste Connections, Inc. (WCN) offer intriguing insights into how different industries manage their expenses. Over the past decade, ADP's cost of revenue has seen a steady increase, rising approximately 45% from 2014 to 2023. This growth reflects ADP's expanding operations and investment in technology-driven solutions. In contrast, Waste Connections, Inc. has experienced a more dramatic rise, with costs nearly quadrupling in the same period, highlighting the company's aggressive expansion and acquisition strategy.
Interestingly, while ADP's cost of revenue consistently grew year-over-year, Waste Connections showed a more volatile pattern, with significant jumps in 2016 and 2019. The data for 2024 remains incomplete, suggesting ongoing developments in these companies' financial strategies. This analysis underscores the importance of strategic cost management in maintaining competitive advantage.
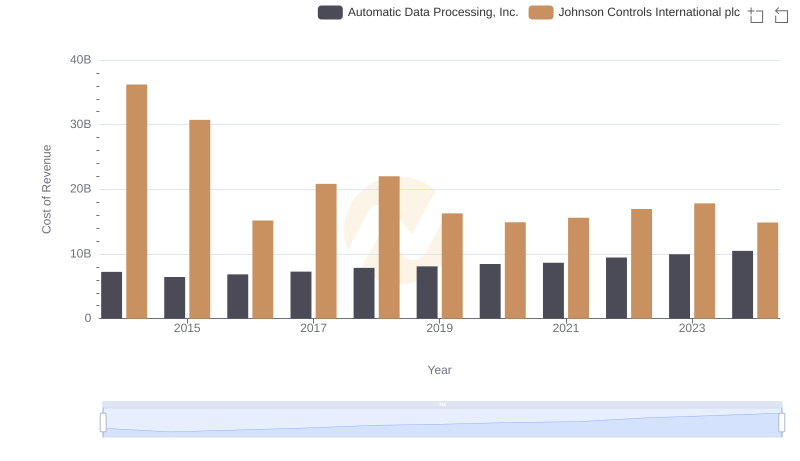
Cost Insights: Breaking Down Automatic Data Processing, Inc. and Johnson Controls International plc's Expenses
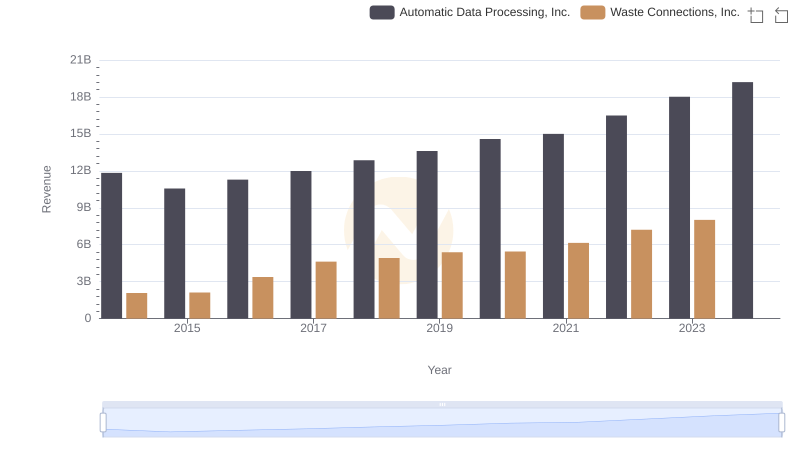
Annual Revenue Comparison: Automatic Data Processing, Inc. vs Waste Connections, Inc.
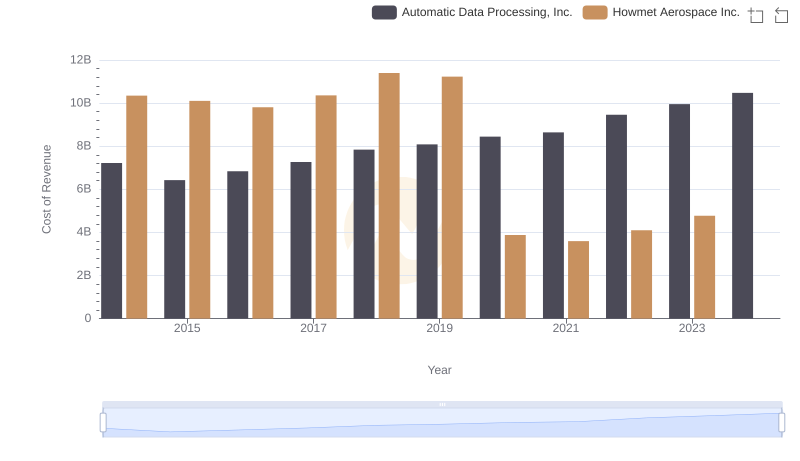
Analyzing Cost of Revenue: Automatic Data Processing, Inc. and Howmet Aerospace Inc.
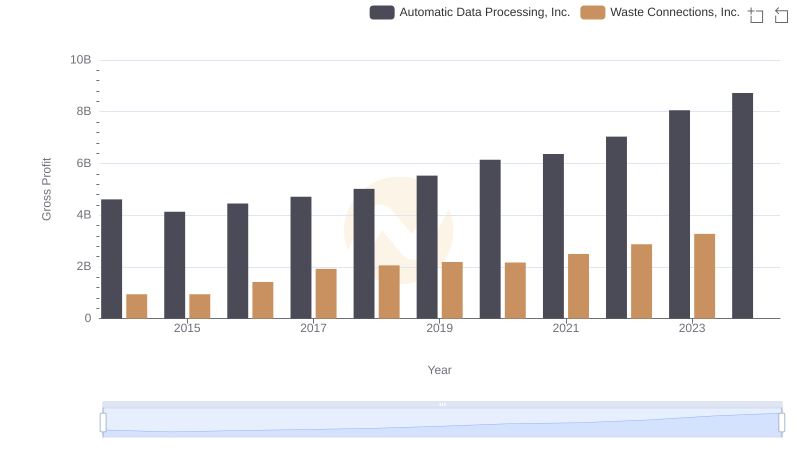
Automatic Data Processing, Inc. and Waste Connections, Inc.: A Detailed Gross Profit Analysis
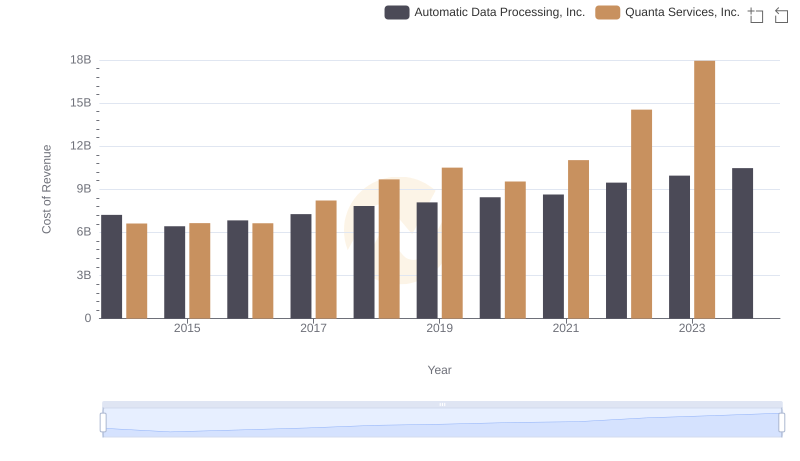
Analyzing Cost of Revenue: Automatic Data Processing, Inc. and Quanta Services, Inc.
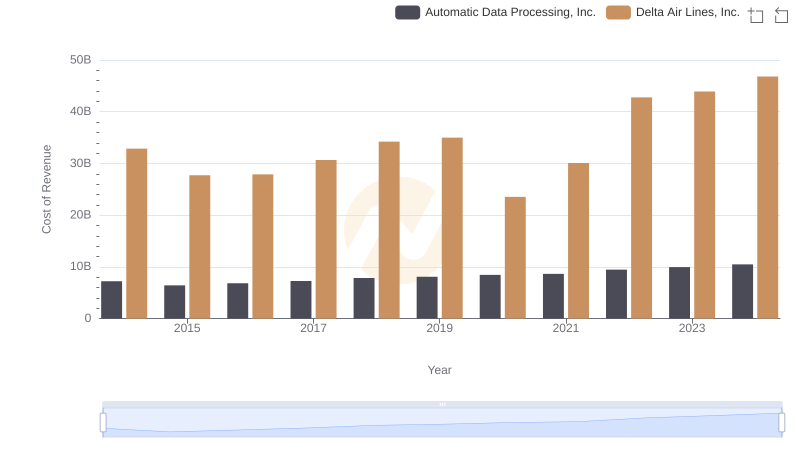
Comparing Cost of Revenue Efficiency: Automatic Data Processing, Inc. vs Delta Air Lines, Inc.
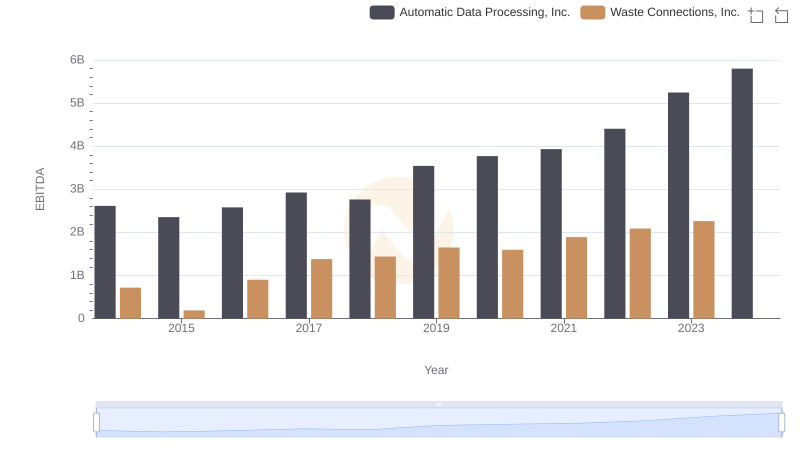
Professional EBITDA Benchmarking: Automatic Data Processing, Inc. vs Waste Connections, Inc.