| __timestamp | Howmet Aerospace Inc. | Parker-Hannifin Corporation |
|---|---|---|
| Wednesday, January 1, 2014 | 12542000000 | 13215971000 |
| Thursday, January 1, 2015 | 12413000000 | 12711744000 |
| Friday, January 1, 2016 | 12394000000 | 11360753000 |
| Sunday, January 1, 2017 | 12960000000 | 12029312000 |
| Monday, January 1, 2018 | 14014000000 | 14302392000 |
| Tuesday, January 1, 2019 | 14192000000 | 14320324000 |
| Wednesday, January 1, 2020 | 5259000000 | 13695520000 |
| Friday, January 1, 2021 | 4972000000 | 14347640000 |
| Saturday, January 1, 2022 | 5663000000 | 15861608000 |
| Sunday, January 1, 2023 | 6640000000 | 19065194000 |
| Monday, January 1, 2024 | 7430000000 | 19929606000 |
Igniting the spark of knowledge
In the ever-evolving landscape of industrial manufacturing, Parker-Hannifin Corporation and Howmet Aerospace Inc. have showcased intriguing revenue trajectories over the past decade. From 2014 to 2023, Parker-Hannifin's revenue surged by approximately 44%, peaking at nearly $19 billion in 2023. This growth reflects the company's robust adaptation to market demands and strategic expansions.
Conversely, Howmet Aerospace experienced a more volatile journey. After a strong start in 2014, with revenues around $12.5 billion, the company faced a significant dip in 2020, dropping to nearly half its previous figures. However, a resilient recovery followed, with revenues climbing back to $6.6 billion by 2023.
These trends highlight the dynamic nature of the industrial sector, where adaptability and innovation are key. As we look to the future, the missing data for 2024 leaves room for speculation and anticipation.
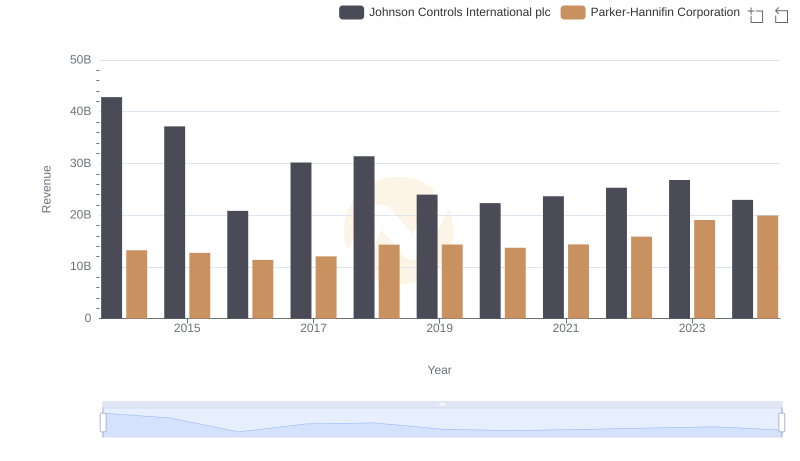
Who Generates More Revenue? Parker-Hannifin Corporation or Johnson Controls International plc
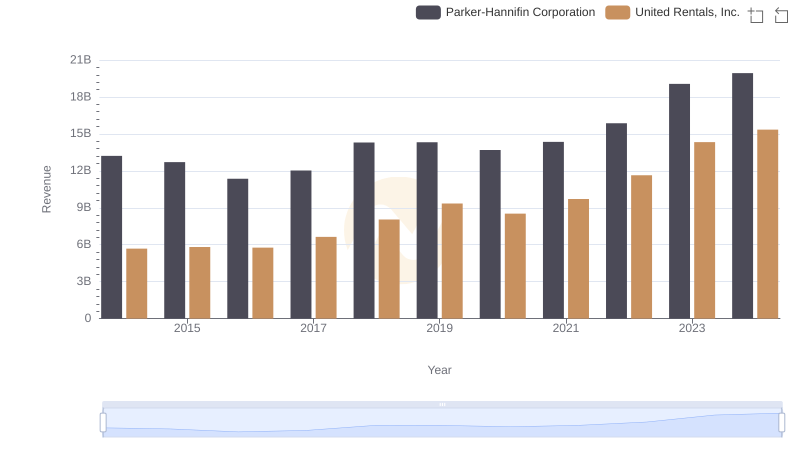
Parker-Hannifin Corporation vs United Rentals, Inc.: Examining Key Revenue Metrics
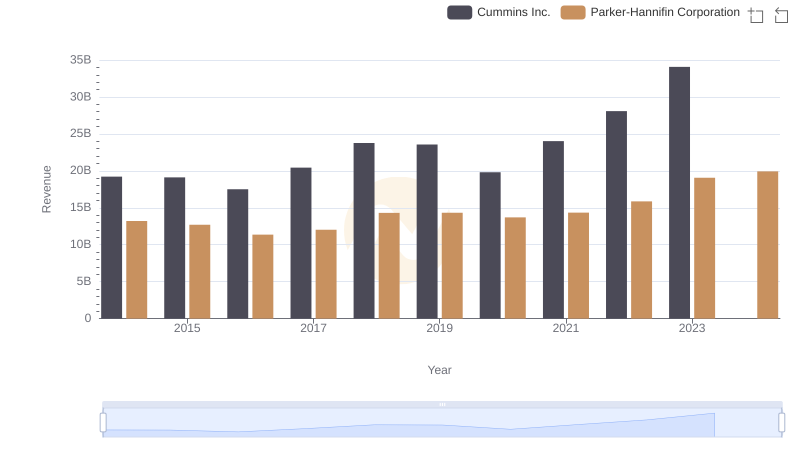
Parker-Hannifin Corporation vs Cummins Inc.: Examining Key Revenue Metrics
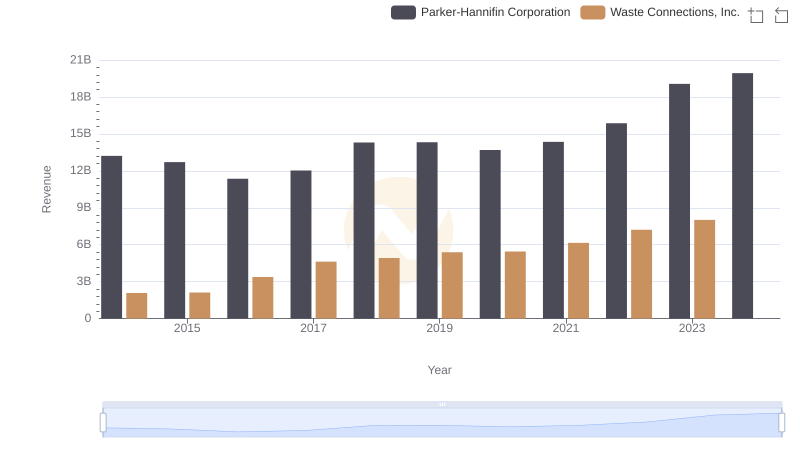
Parker-Hannifin Corporation vs Waste Connections, Inc.: Annual Revenue Growth Compared
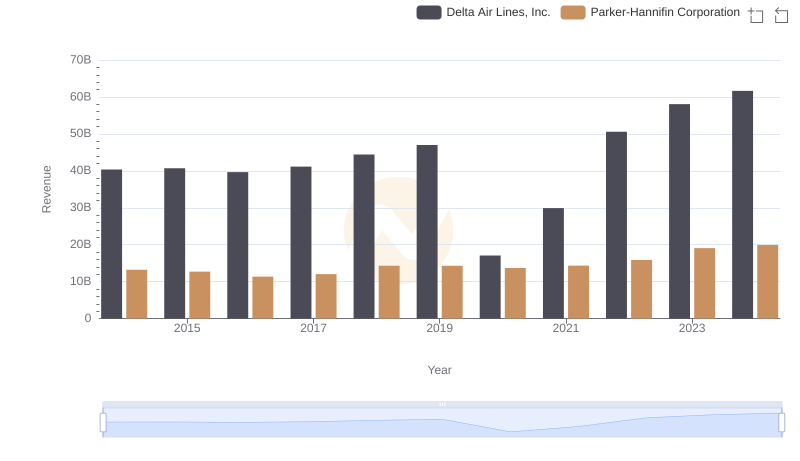
Parker-Hannifin Corporation or Delta Air Lines, Inc.: Who Leads in Yearly Revenue?
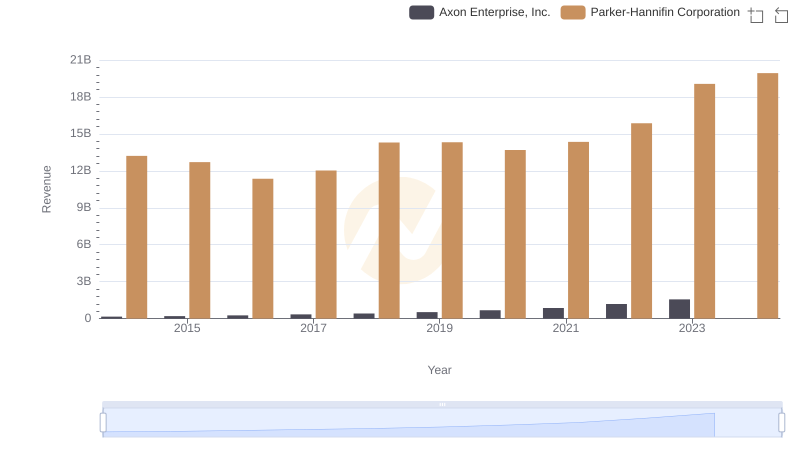
Breaking Down Revenue Trends: Parker-Hannifin Corporation vs Axon Enterprise, Inc.
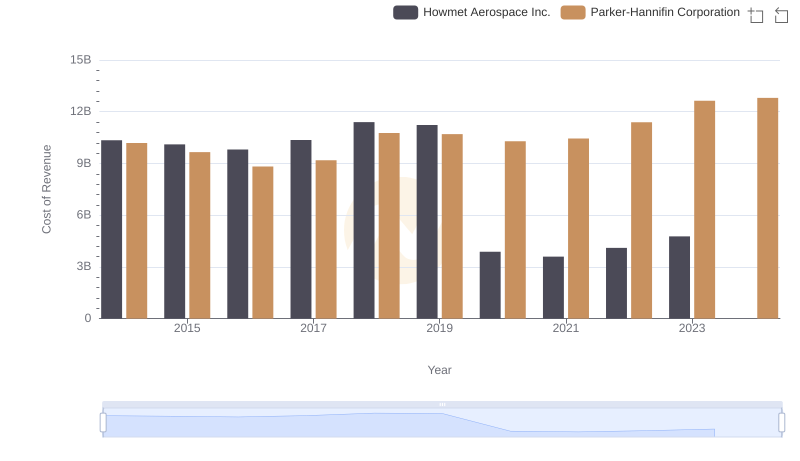
Analyzing Cost of Revenue: Parker-Hannifin Corporation and Howmet Aerospace Inc.
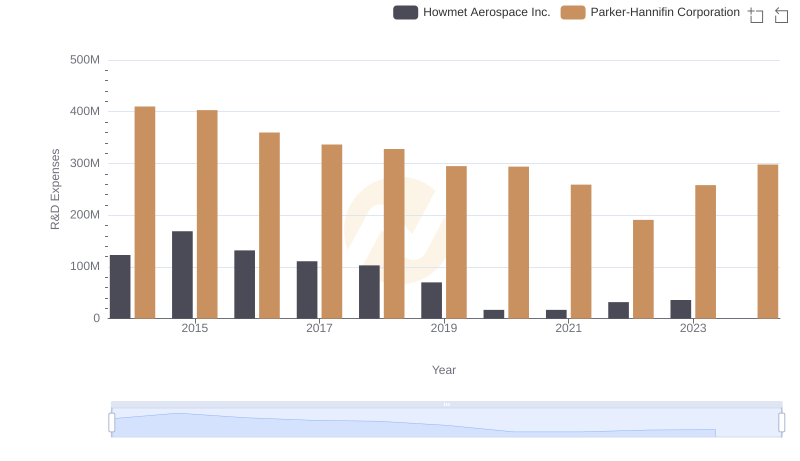
Analyzing R&D Budgets: Parker-Hannifin Corporation vs Howmet Aerospace Inc.
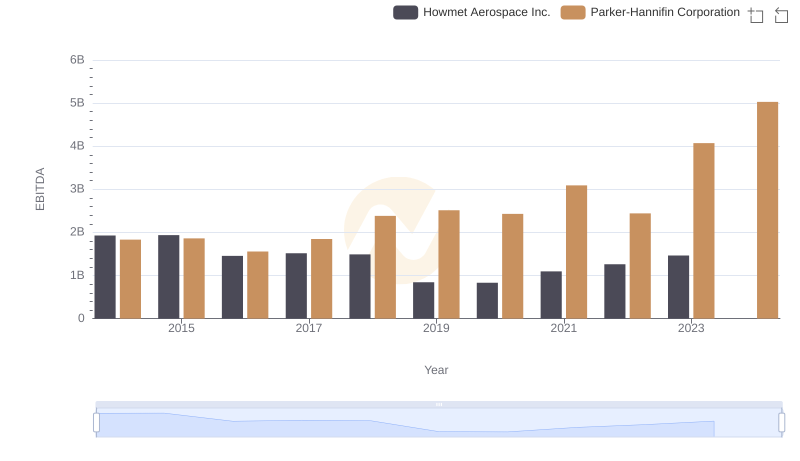
A Side-by-Side Analysis of EBITDA: Parker-Hannifin Corporation and Howmet Aerospace Inc.