| __timestamp | Graco Inc. | The Boeing Company |
|---|---|---|
| Wednesday, January 1, 2014 | 303565000 | 3767000000 |
| Thursday, January 1, 2015 | 324016000 | 3525000000 |
| Friday, January 1, 2016 | 341734000 | 3616000000 |
| Sunday, January 1, 2017 | 372496000 | 4094000000 |
| Monday, January 1, 2018 | 382988000 | 4567000000 |
| Tuesday, January 1, 2019 | 367743000 | 3909000000 |
| Wednesday, January 1, 2020 | 355796000 | 4817000000 |
| Friday, January 1, 2021 | 422975000 | 4157000000 |
| Saturday, January 1, 2022 | 404731000 | 4187000000 |
| Sunday, January 1, 2023 | 432156000 | 5168000000 |
| Monday, January 1, 2024 | 465133000 | 5021000000 |
Cracking the code
In the ever-evolving landscape of corporate finance, understanding the nuances of Selling, General, and Administrative (SG&A) expenses is crucial. This analysis delves into the SG&A spending patterns of two industry giants: The Boeing Company and Graco Inc., from 2014 to 2024.
Over the past decade, Boeing's SG&A expenses have consistently dwarfed those of Graco, averaging around 4.3 billion annually, compared to Graco's 379 million. Notably, Boeing's SG&A expenses peaked in 2023, reaching approximately 5.2 billion, a 37% increase from 2014. Meanwhile, Graco's expenses showed a steady upward trend, culminating in a 53% rise over the same period.
These spending patterns reflect strategic priorities and operational scales. Boeing's substantial SG&A outlay underscores its expansive global operations, while Graco's more modest spending aligns with its focused market approach. Understanding these dynamics offers valuable insights into each company's strategic direction and market positioning.
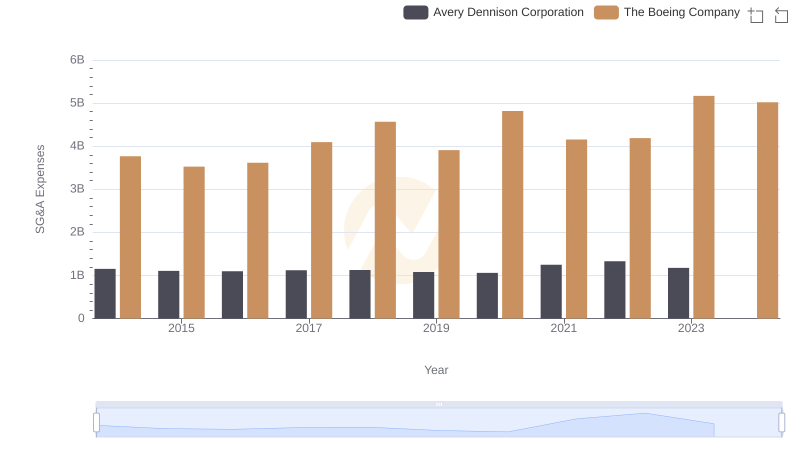
SG&A Efficiency Analysis: Comparing The Boeing Company and Avery Dennison Corporation
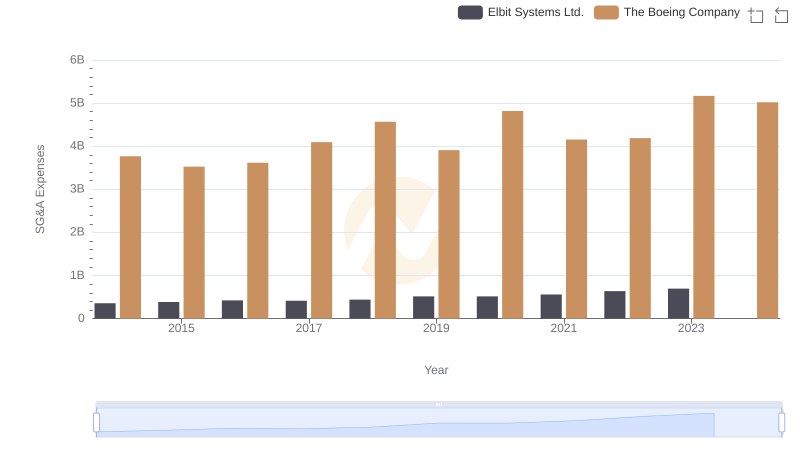
Operational Costs Compared: SG&A Analysis of The Boeing Company and Elbit Systems Ltd.
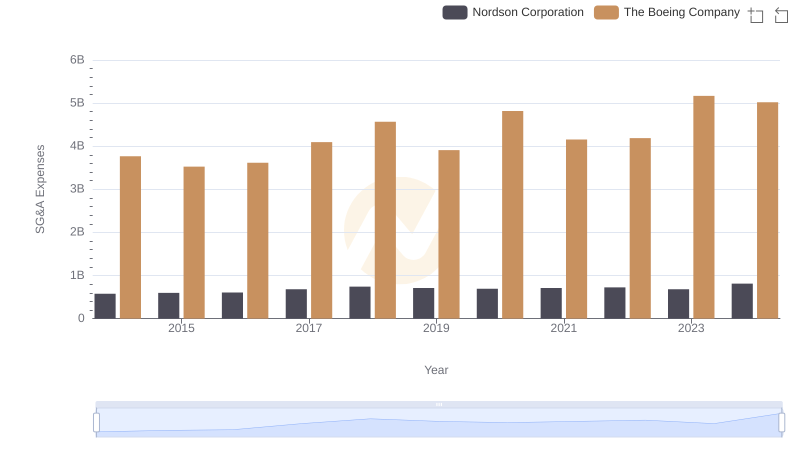
Operational Costs Compared: SG&A Analysis of The Boeing Company and Nordson Corporation
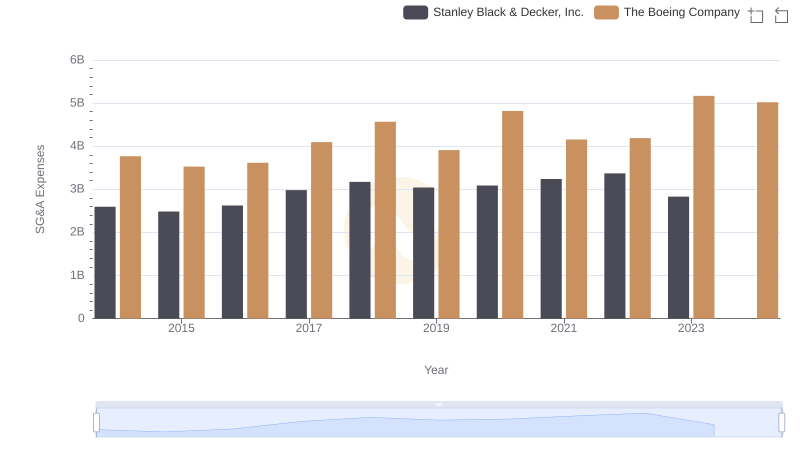
The Boeing Company or Stanley Black & Decker, Inc.: Who Manages SG&A Costs Better?