| __timestamp | Axon Enterprise, Inc. | Verisk Analytics, Inc. |
|---|---|---|
| Wednesday, January 1, 2014 | 54158000 | 227306000 |
| Thursday, January 1, 2015 | 69698000 | 312690000 |
| Friday, January 1, 2016 | 108076000 | 301600000 |
| Sunday, January 1, 2017 | 138692000 | 322800000 |
| Monday, January 1, 2018 | 156886000 | 378700000 |
| Tuesday, January 1, 2019 | 212959000 | 603500000 |
| Wednesday, January 1, 2020 | 307286000 | 413900000 |
| Friday, January 1, 2021 | 515007000 | 422700000 |
| Saturday, January 1, 2022 | 401575000 | 381500000 |
| Sunday, January 1, 2023 | 496874000 | 389300000 |
Data in motion
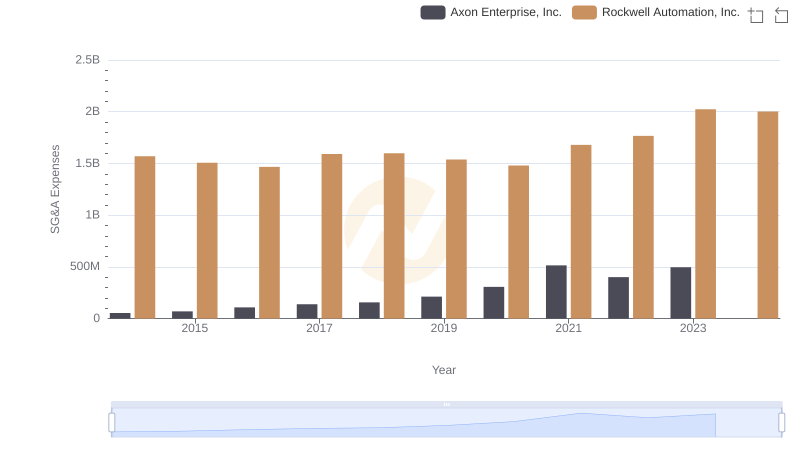
In the ever-evolving landscape of corporate finance, understanding the trends in Selling, General, and Administrative (SG&A) expenses is crucial for investors and analysts alike. Over the past decade, Axon Enterprise, Inc. and Verisk Analytics, Inc. have shown distinct trajectories in their SG&A expenditures.
From 2014 to 2023, Axon Enterprise, Inc. experienced a staggering increase of over 800% in SG&A expenses, peaking in 2021. This reflects the company's aggressive growth strategy and investment in operational capabilities. In contrast, Verisk Analytics, Inc. maintained a more stable SG&A trend, with a modest 71% increase over the same period, indicating a focus on efficiency and cost management.
These insights provide a window into the strategic priorities of these companies, offering valuable context for stakeholders looking to understand their financial health and operational focus.
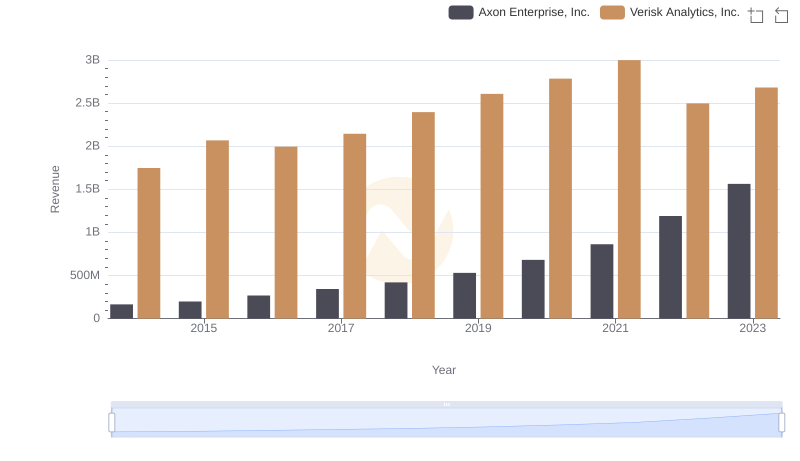
Axon Enterprise, Inc. or Verisk Analytics, Inc.: Who Leads in Yearly Revenue?
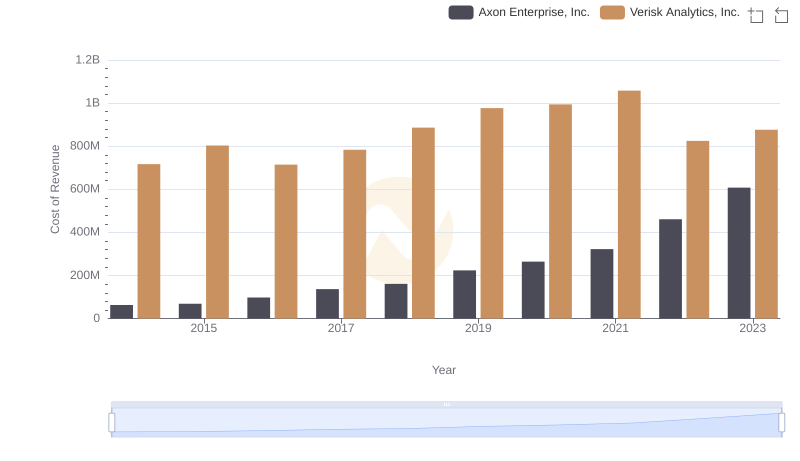
Comparing Cost of Revenue Efficiency: Axon Enterprise, Inc. vs Verisk Analytics, Inc.
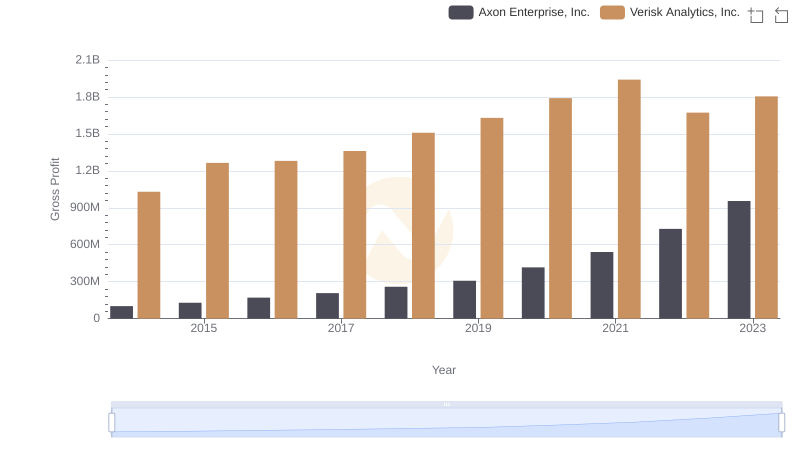
Gross Profit Trends Compared: Axon Enterprise, Inc. vs Verisk Analytics, Inc.
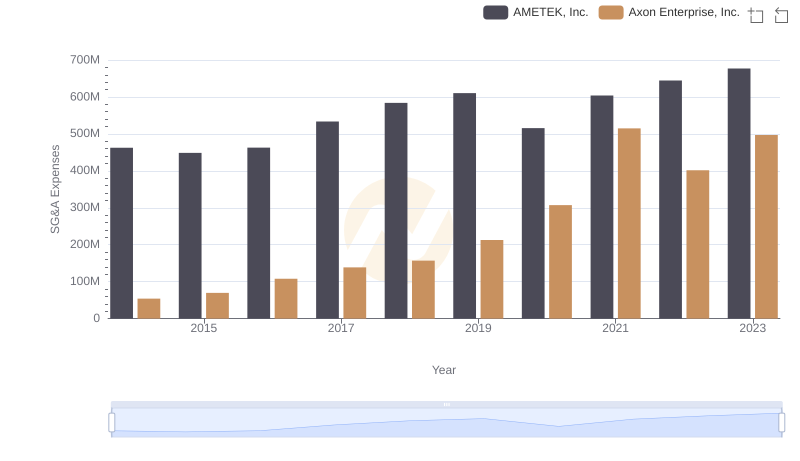
SG&A Efficiency Analysis: Comparing Axon Enterprise, Inc. and AMETEK, Inc.
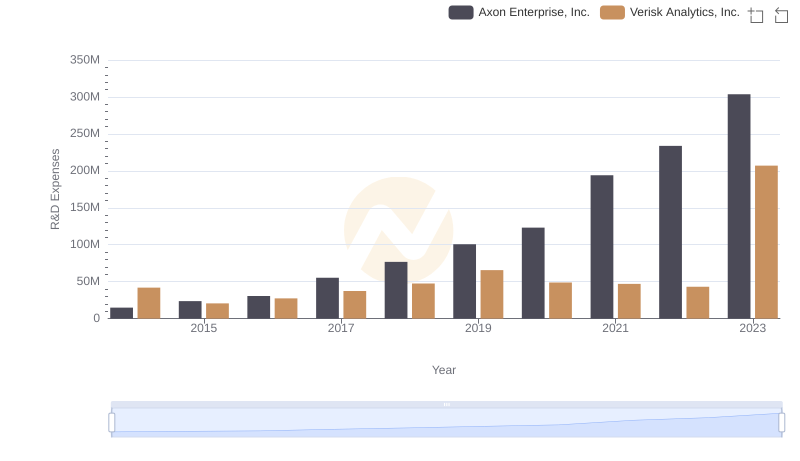
Research and Development Expenses Breakdown: Axon Enterprise, Inc. vs Verisk Analytics, Inc.
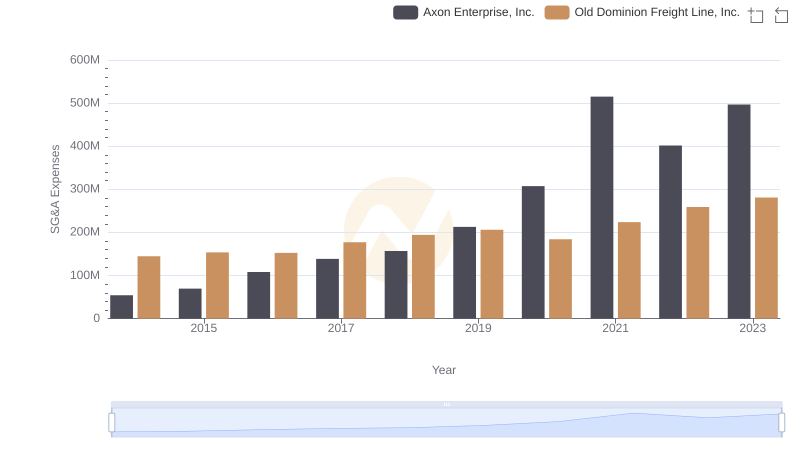
Breaking Down SG&A Expenses: Axon Enterprise, Inc. vs Old Dominion Freight Line, Inc.
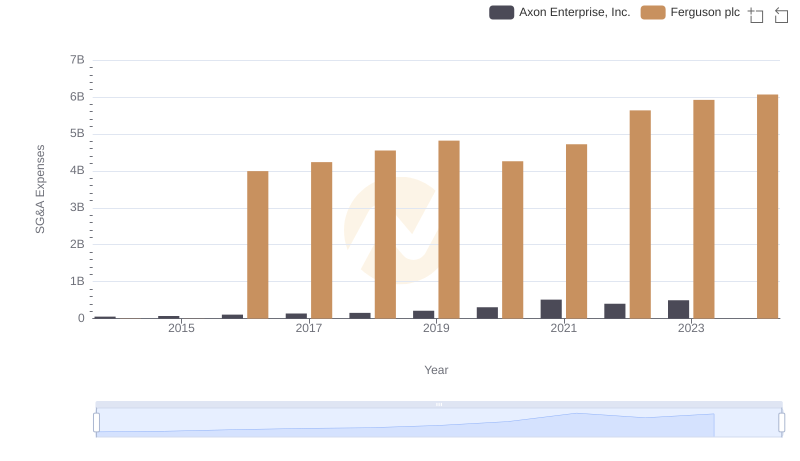
Axon Enterprise, Inc. or Ferguson plc: Who Manages SG&A Costs Better?
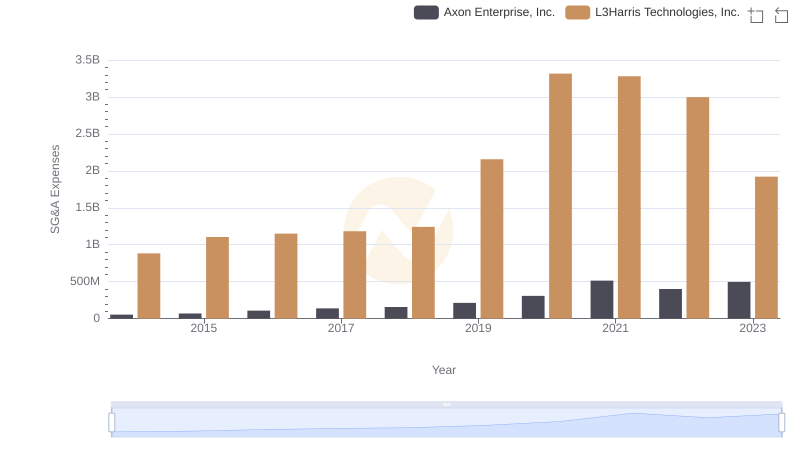
Selling, General, and Administrative Costs: Axon Enterprise, Inc. vs L3Harris Technologies, Inc.
Operational Costs Compared: SG&A Analysis of Axon Enterprise, Inc. and Rockwell Automation, Inc.