| __timestamp | Automatic Data Processing, Inc. | Rockwell Automation, Inc. |
|---|---|---|
| Wednesday, January 1, 2014 | 2616900000 | 1346000000 |
| Thursday, January 1, 2015 | 2355100000 | 1359100000 |
| Friday, January 1, 2016 | 2579500000 | 1200700000 |
| Sunday, January 1, 2017 | 2927200000 | 1258400000 |
| Monday, January 1, 2018 | 2762900000 | 1568400000 |
| Tuesday, January 1, 2019 | 3544500000 | 1150200000 |
| Wednesday, January 1, 2020 | 3769700000 | 1410200000 |
| Friday, January 1, 2021 | 3931600000 | 1808300000 |
| Saturday, January 1, 2022 | 4405500000 | 1432100000 |
| Sunday, January 1, 2023 | 5244600000 | 1990700000 |
| Monday, January 1, 2024 | 5800000000 | 1567500000 |
Unlocking the unknown
In the ever-evolving landscape of corporate finance, EBITDA serves as a crucial indicator of a company's operational efficiency. Over the past decade, Automatic Data Processing, Inc. (ADP) and Rockwell Automation, Inc. have demonstrated distinct trajectories in their EBITDA performance. From 2014 to 2024, ADP's EBITDA surged by approximately 122%, reflecting its robust growth strategy and market adaptability. In contrast, Rockwell Automation experienced a more modest increase of around 16%, highlighting its steady yet conservative approach.
This analysis provides a compelling snapshot of how these industry giants have navigated financial challenges and opportunities over the years.

Comparing Cost of Revenue Efficiency: Automatic Data Processing, Inc. vs Rockwell Automation, Inc.
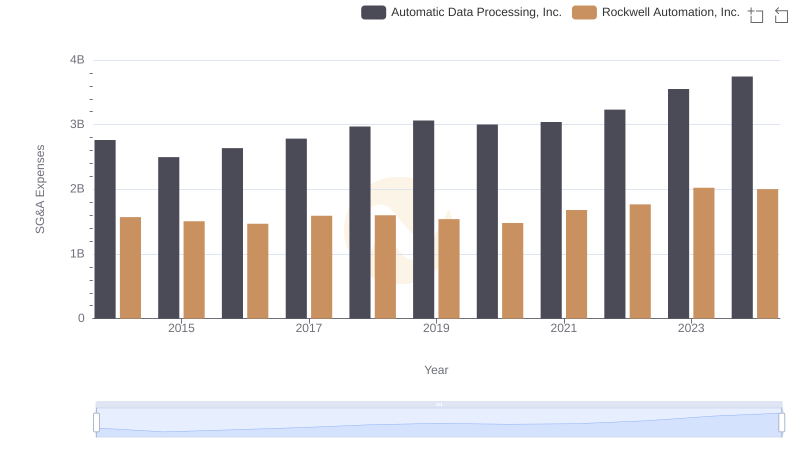
Operational Costs Compared: SG&A Analysis of Automatic Data Processing, Inc. and Rockwell Automation, Inc.
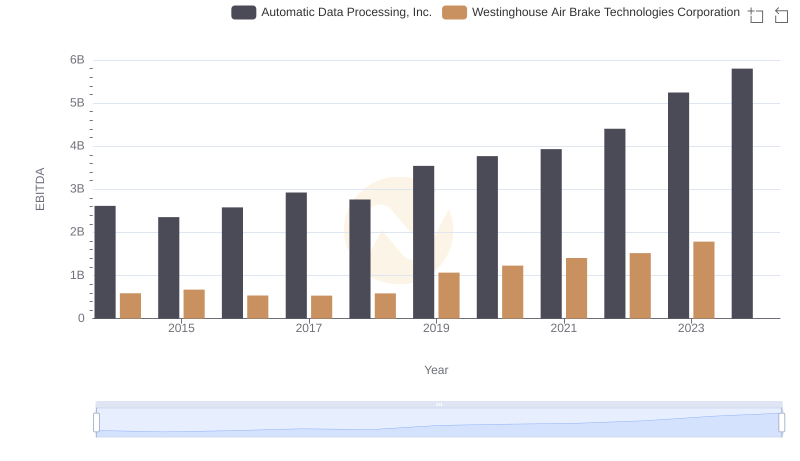
Professional EBITDA Benchmarking: Automatic Data Processing, Inc. vs Westinghouse Air Brake Technologies Corporation
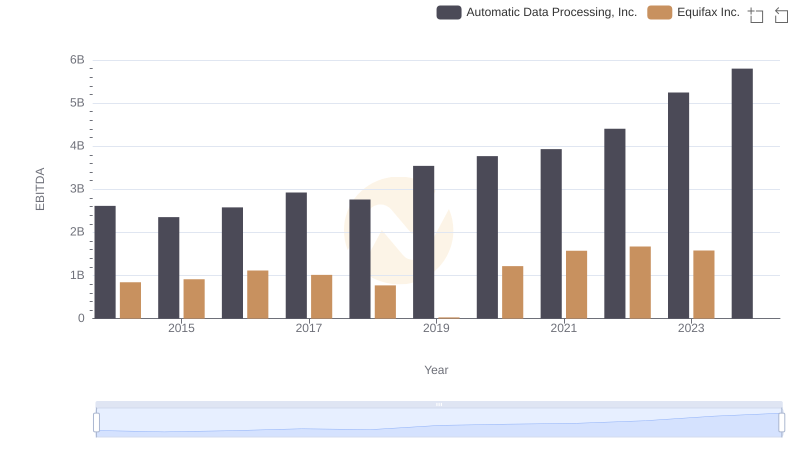
EBITDA Performance Review: Automatic Data Processing, Inc. vs Equifax Inc.

Automatic Data Processing, Inc. vs HEICO Corporation: In-Depth EBITDA Performance Comparison
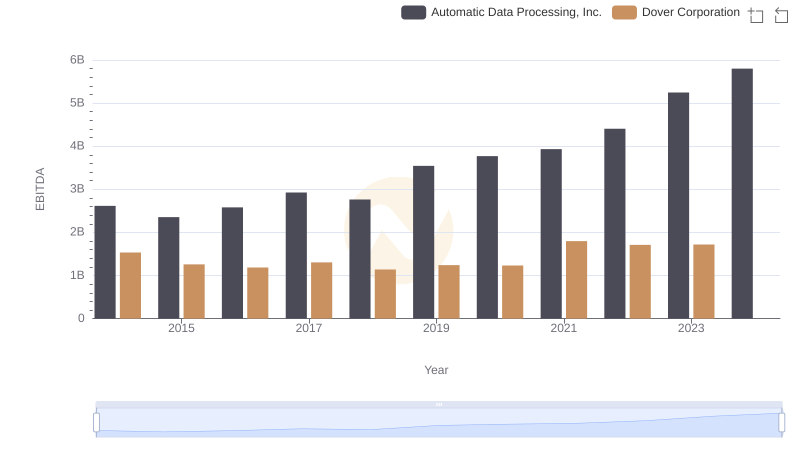
Automatic Data Processing, Inc. and Dover Corporation: A Detailed Examination of EBITDA Performance