| __timestamp | 3M Company | Axon Enterprise, Inc. |
|---|---|---|
| Wednesday, January 1, 2014 | 16447000000 | 62977000 |
| Thursday, January 1, 2015 | 15383000000 | 69245000 |
| Friday, January 1, 2016 | 15040000000 | 97709000 |
| Sunday, January 1, 2017 | 16001000000 | 136710000 |
| Monday, January 1, 2018 | 16682000000 | 161485000 |
| Tuesday, January 1, 2019 | 17136000000 | 223574000 |
| Wednesday, January 1, 2020 | 16605000000 | 264672000 |
| Friday, January 1, 2021 | 18795000000 | 322471000 |
| Saturday, January 1, 2022 | 19232000000 | 461297000 |
| Sunday, January 1, 2023 | 18477000000 | 608009000 |
| Monday, January 1, 2024 | 14447000000 |
Unveiling the hidden dimensions of data
In the ever-evolving landscape of American industry, the cost of revenue is a critical metric that reflects a company's efficiency and market strategy. Over the past decade, 3M Company and Axon Enterprise, Inc. have showcased contrasting trends in this regard.
From 2014 to 2023, 3M Company has consistently maintained a high cost of revenue, peaking in 2022 with a 17% increase from 2014. However, 2024 shows a notable dip, indicating potential strategic shifts or market challenges.
Conversely, Axon Enterprise, Inc. has experienced a remarkable growth trajectory, with its cost of revenue surging by nearly 900% from 2014 to 2023. This growth underscores Axon's expanding market presence and operational scaling.
While 3M's cost of revenue reflects its established market position, Axon's rapid increase highlights its dynamic growth strategy. Missing data for 2024 suggests ongoing developments worth watching.
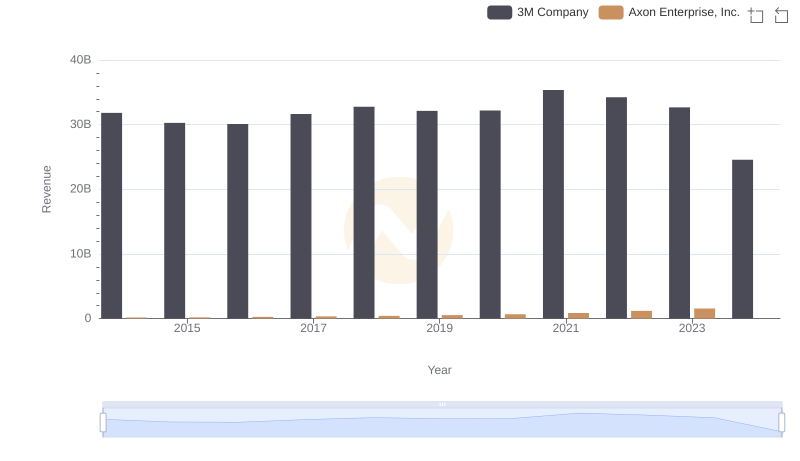
Revenue Showdown: 3M Company vs Axon Enterprise, Inc.
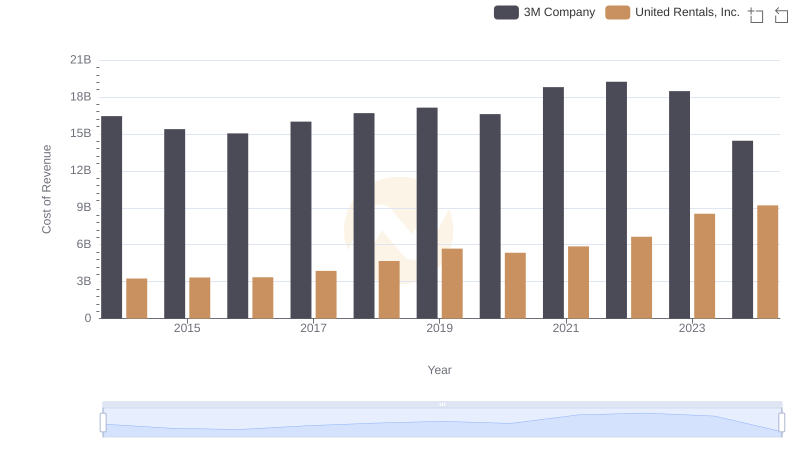
3M Company vs United Rentals, Inc.: Efficiency in Cost of Revenue Explored
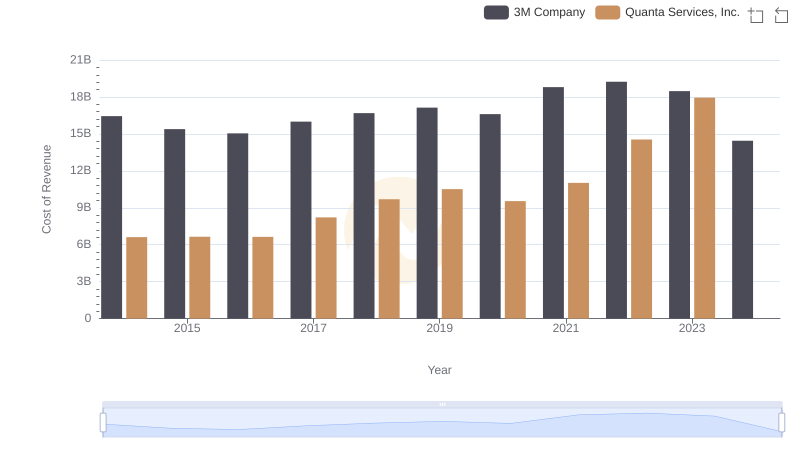
3M Company vs Quanta Services, Inc.: Efficiency in Cost of Revenue Explored
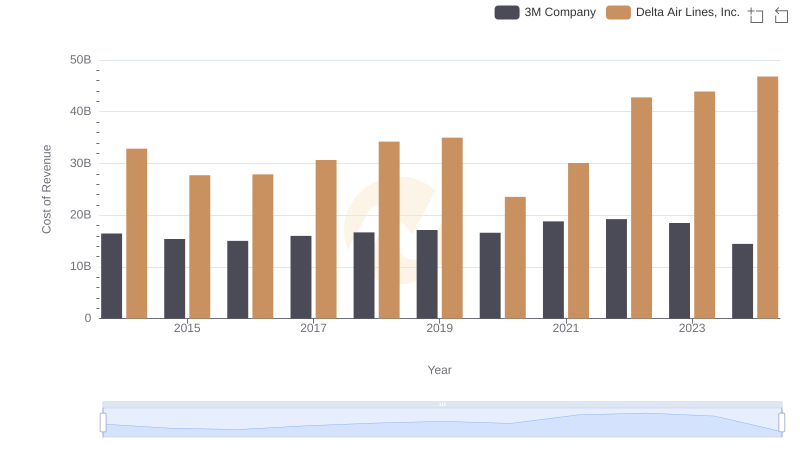
Analyzing Cost of Revenue: 3M Company and Delta Air Lines, Inc.
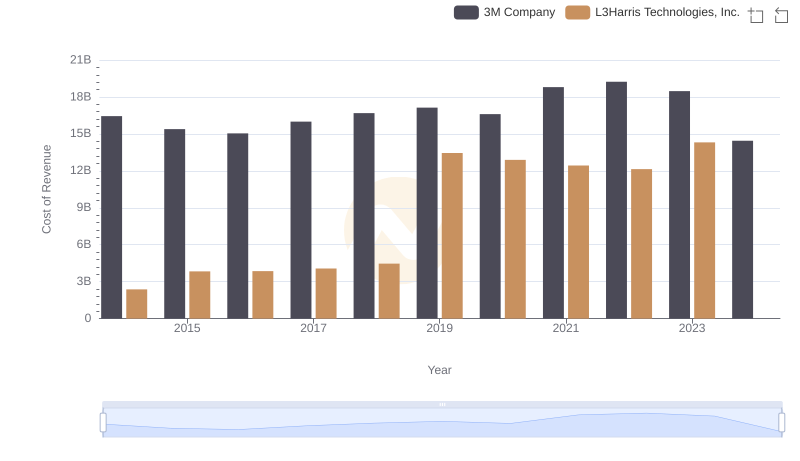
Cost of Revenue Trends: 3M Company vs L3Harris Technologies, Inc.
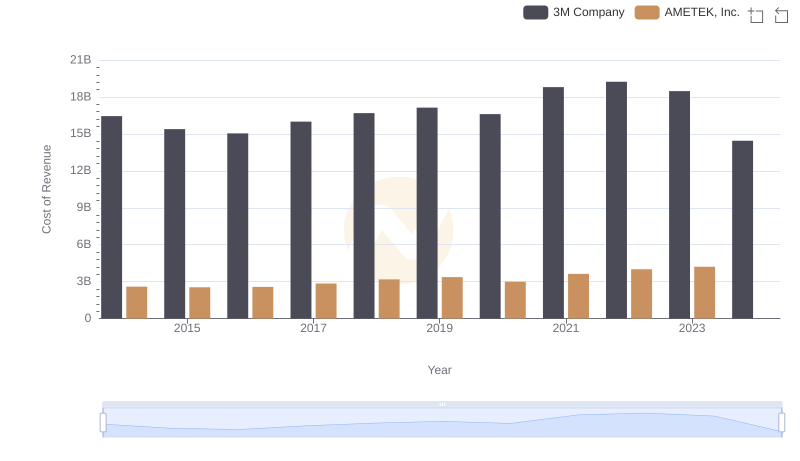
Cost of Revenue Comparison: 3M Company vs AMETEK, Inc.
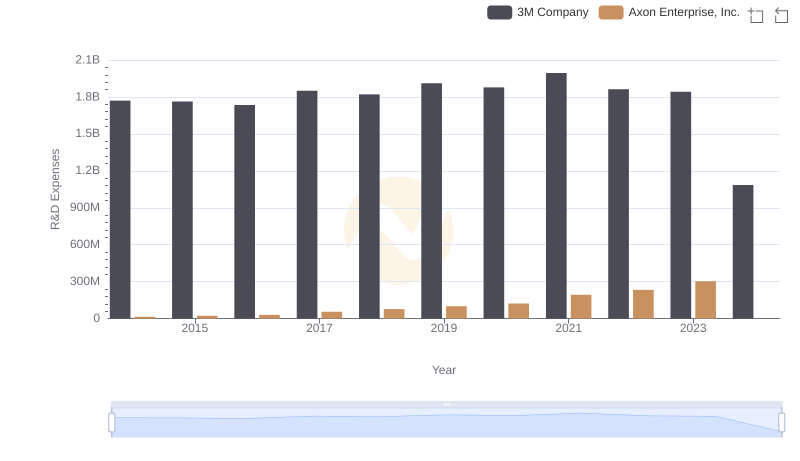
3M Company or Axon Enterprise, Inc.: Who Invests More in Innovation?

Operational Costs Compared: SG&A Analysis of 3M Company and Axon Enterprise, Inc.