| __timestamp | Ingersoll Rand Inc. | Old Dominion Freight Line, Inc. |
|---|---|---|
| Wednesday, January 1, 2014 | 476000000 | 144817000 |
| Thursday, January 1, 2015 | 427000000 | 153589000 |
| Friday, January 1, 2016 | 414339000 | 152391000 |
| Sunday, January 1, 2017 | 446600000 | 177205000 |
| Monday, January 1, 2018 | 434600000 | 194368000 |
| Tuesday, January 1, 2019 | 436400000 | 206125000 |
| Wednesday, January 1, 2020 | 894800000 | 184185000 |
| Friday, January 1, 2021 | 1028000000 | 223757000 |
| Saturday, January 1, 2022 | 1095800000 | 258883000 |
| Sunday, January 1, 2023 | 1272700000 | 281053000 |
| Monday, January 1, 2024 | 0 |
Infusing magic into the data realm
In the world of corporate finance, understanding the trends in Selling, General, and Administrative (SG&A) expenses can offer valuable insights into a company's operational efficiency. Over the past decade, Ingersoll Rand Inc. and Old Dominion Freight Line, Inc. have shown contrasting trajectories in their SG&A expenses.
From 2014 to 2023, Ingersoll Rand Inc. experienced a significant increase in SG&A expenses, rising by approximately 167%. This upward trend reflects strategic investments and potential expansions, peaking in 2023 with expenses reaching over 1.27 billion.
Conversely, Old Dominion Freight Line, Inc. maintained a more modest growth in SG&A expenses, increasing by about 94% over the same period. This steady rise suggests a focus on cost control and operational efficiency, culminating in 2023 with expenses of around 281 million.
These trends highlight the diverse strategies employed by these industry leaders in managing their operational costs.
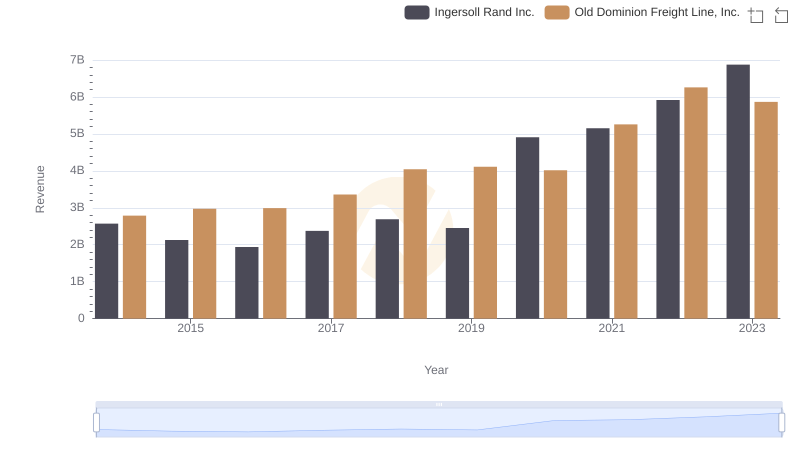
Old Dominion Freight Line, Inc. vs Ingersoll Rand Inc.: Examining Key Revenue Metrics
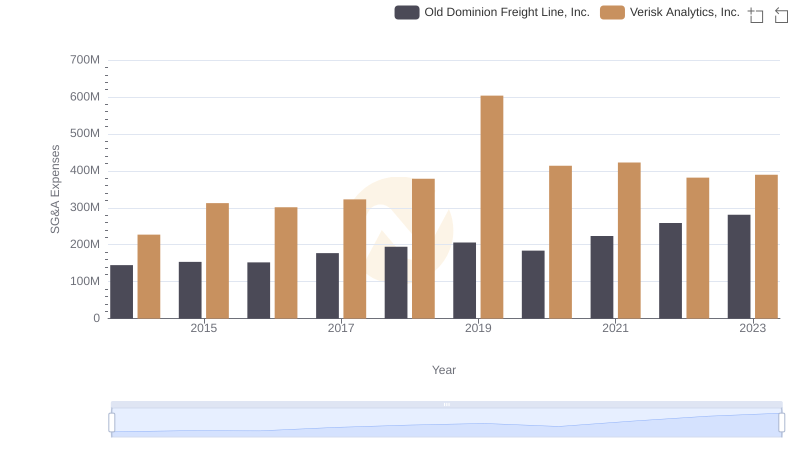
Operational Costs Compared: SG&A Analysis of Old Dominion Freight Line, Inc. and Verisk Analytics, Inc.
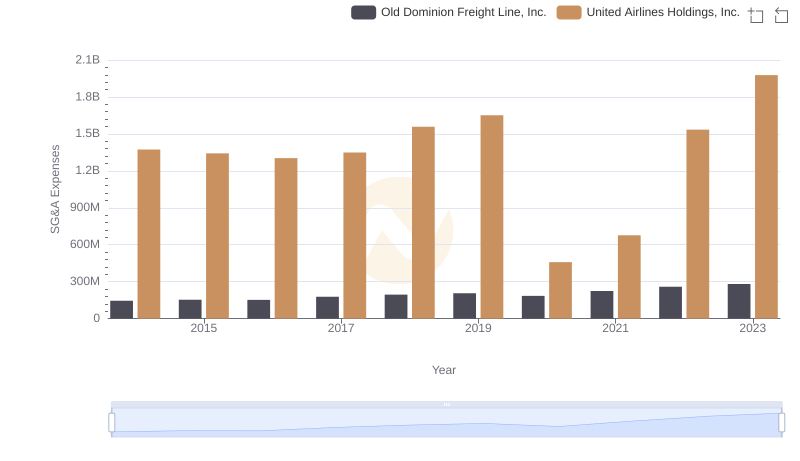
Who Optimizes SG&A Costs Better? Old Dominion Freight Line, Inc. or United Airlines Holdings, Inc.
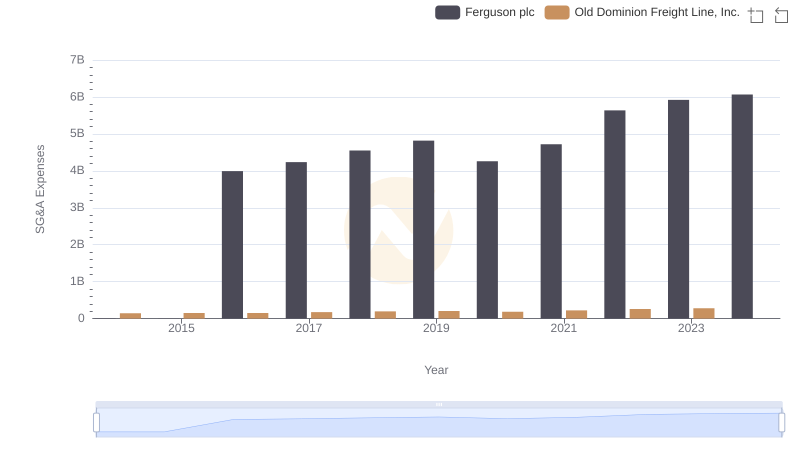
Cost Management Insights: SG&A Expenses for Old Dominion Freight Line, Inc. and Ferguson plc
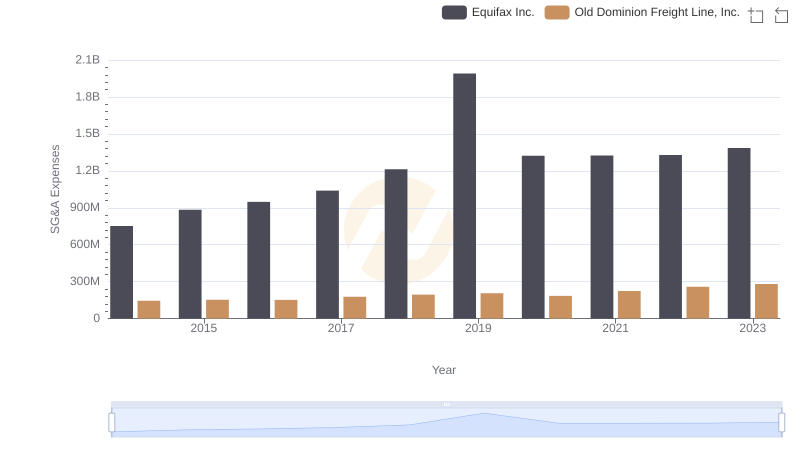
Who Optimizes SG&A Costs Better? Old Dominion Freight Line, Inc. or Equifax Inc.
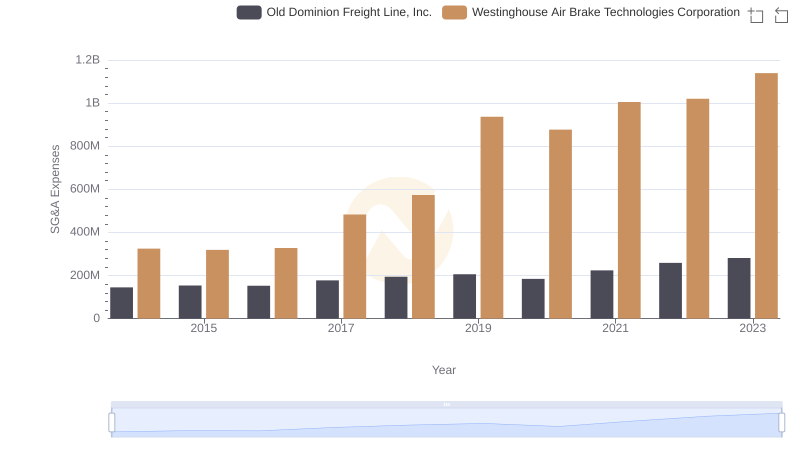
Old Dominion Freight Line, Inc. or Westinghouse Air Brake Technologies Corporation: Who Manages SG&A Costs Better?
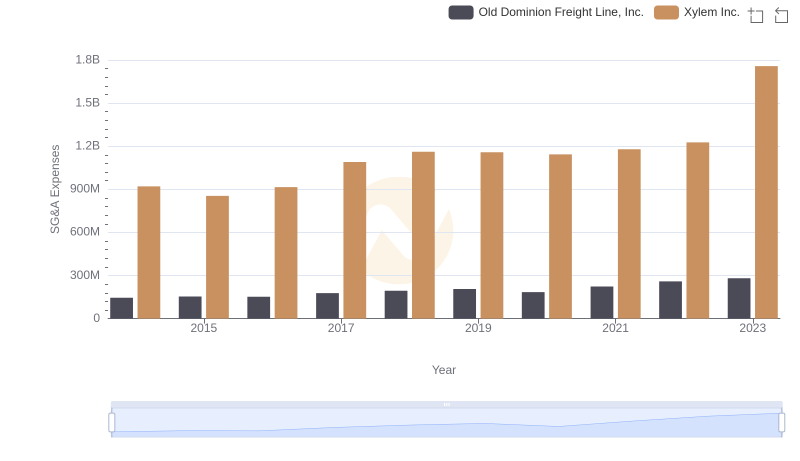
Operational Costs Compared: SG&A Analysis of Old Dominion Freight Line, Inc. and Xylem Inc.
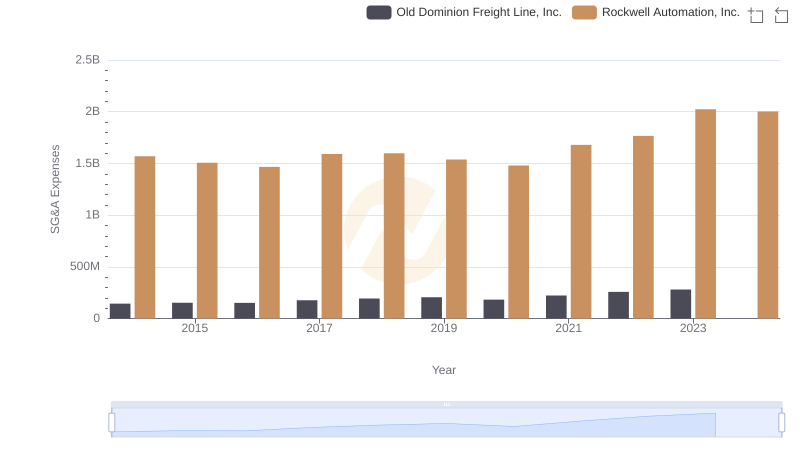
Operational Costs Compared: SG&A Analysis of Old Dominion Freight Line, Inc. and Rockwell Automation, Inc.
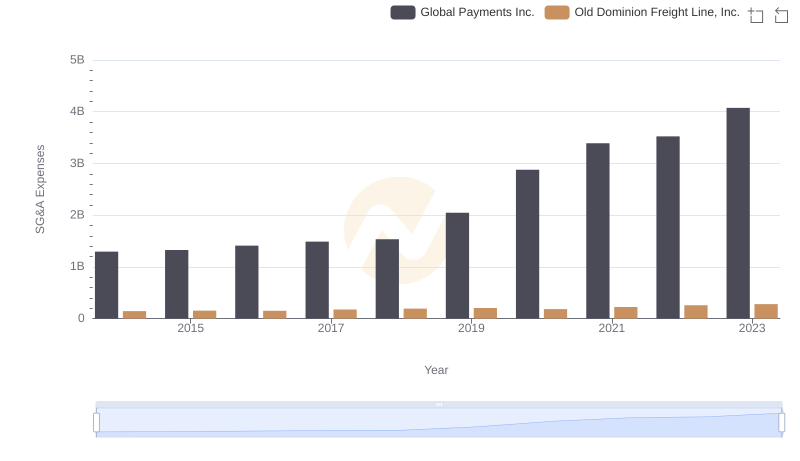
Comparing SG&A Expenses: Old Dominion Freight Line, Inc. vs Global Payments Inc. Trends and Insights
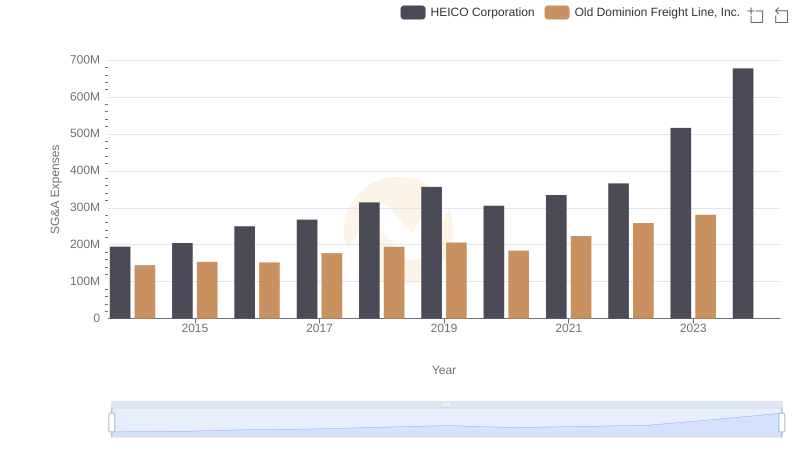
Selling, General, and Administrative Costs: Old Dominion Freight Line, Inc. vs HEICO Corporation