| __timestamp | 3M Company | Ingersoll Rand Inc. |
|---|---|---|
| Wednesday, January 1, 2014 | 15374000000 | 936781000 |
| Thursday, January 1, 2015 | 14891000000 | 779100000 |
| Friday, January 1, 2016 | 15069000000 | 716731000 |
| Sunday, January 1, 2017 | 15656000000 | 897900000 |
| Monday, January 1, 2018 | 16083000000 | 1012500000 |
| Tuesday, January 1, 2019 | 15000000000 | 911700000 |
| Wednesday, January 1, 2020 | 15579000000 | 1613400000 |
| Friday, January 1, 2021 | 16560000000 | 1988500000 |
| Saturday, January 1, 2022 | 14997000000 | 2325600000 |
| Sunday, January 1, 2023 | 14204000000 | 2882200000 |
| Monday, January 1, 2024 | 10128000000 | 0 |
Data in motion
In the ever-evolving landscape of industrial giants, 3M Company and Ingersoll Rand Inc. have showcased intriguing financial trajectories over the past decade. From 2014 to 2023, 3M's gross profit has seen fluctuations, peaking in 2021 with a 10% increase from 2014, before experiencing a decline by 2023. Meanwhile, Ingersoll Rand Inc. has demonstrated a remarkable upward trend, with its gross profit more than tripling from 2014 to 2023.
These trends highlight the dynamic nature of the industrial sector, where strategic decisions and market conditions play pivotal roles in shaping financial outcomes.
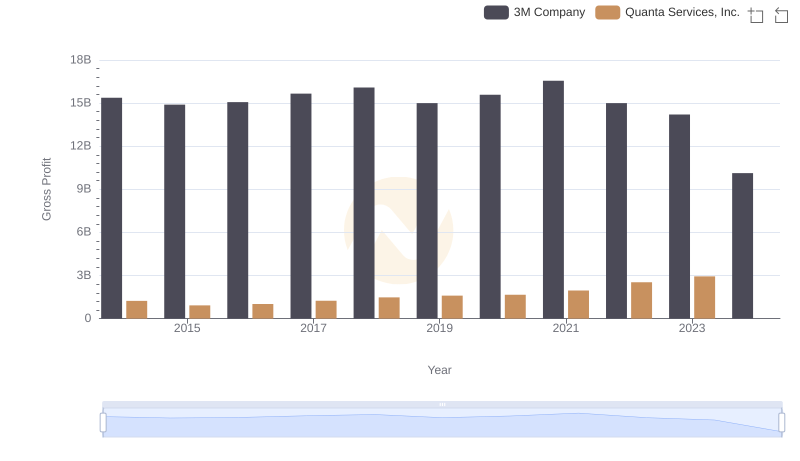
Gross Profit Comparison: 3M Company and Quanta Services, Inc. Trends

Cost of Revenue Comparison: 3M Company vs Ingersoll Rand Inc.
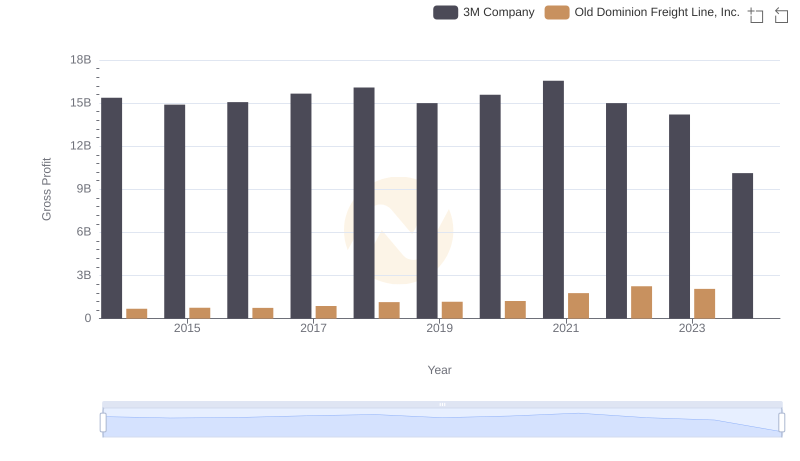
Key Insights on Gross Profit: 3M Company vs Old Dominion Freight Line, Inc.
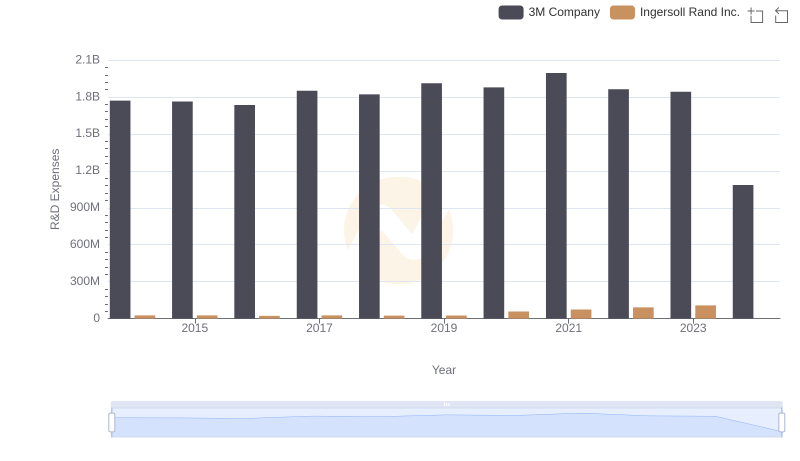
Research and Development Expenses Breakdown: 3M Company vs Ingersoll Rand Inc.
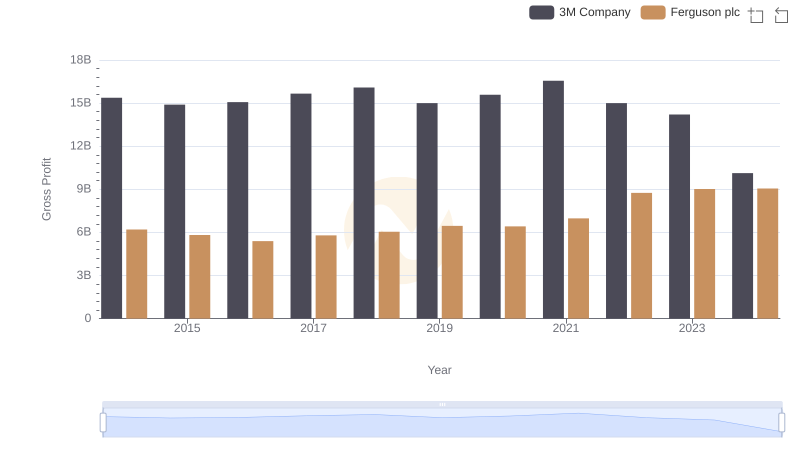
Gross Profit Trends Compared: 3M Company vs Ferguson plc

Key Insights on Gross Profit: 3M Company vs Equifax Inc.