| __timestamp | 3M Company | Ferguson plc |
|---|---|---|
| Wednesday, January 1, 2014 | 15374000000 | 6203188666 |
| Thursday, January 1, 2015 | 14891000000 | 5816457079 |
| Friday, January 1, 2016 | 15069000000 | 5389727937 |
| Sunday, January 1, 2017 | 15656000000 | 5793596551 |
| Monday, January 1, 2018 | 16083000000 | 6044000000 |
| Tuesday, January 1, 2019 | 15000000000 | 6458000000 |
| Wednesday, January 1, 2020 | 15579000000 | 6421000000 |
| Friday, January 1, 2021 | 16560000000 | 6980000000 |
| Saturday, January 1, 2022 | 14997000000 | 8756000000 |
| Sunday, January 1, 2023 | 14204000000 | 9025000000 |
| Monday, January 1, 2024 | 10128000000 | 9053000000 |
Unlocking the unknown
In the ever-evolving landscape of global business, the financial performance of industry leaders like 3M Company and Ferguson plc offers a fascinating glimpse into market dynamics. Over the past decade, from 2014 to 2024, these two titans have showcased contrasting trajectories in their gross profit margins.
3M Company, a stalwart in the manufacturing sector, experienced a peak in 2021 with a gross profit of approximately $16.56 billion. However, by 2024, this figure had declined by nearly 39% to around $10.13 billion. This downward trend highlights the challenges faced by traditional manufacturing firms in adapting to new market conditions.
Conversely, Ferguson plc, a leader in the distribution of plumbing and heating products, has seen a steady rise. From 2014 to 2024, Ferguson's gross profit surged by about 46%, reaching approximately $9.05 billion. This growth underscores the resilience and adaptability of distribution-focused businesses in a rapidly changing economic environment.
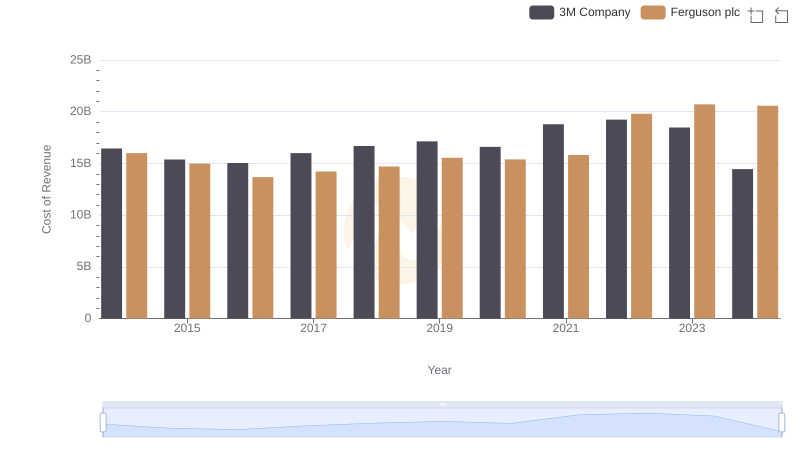
Cost of Revenue: Key Insights for 3M Company and Ferguson plc
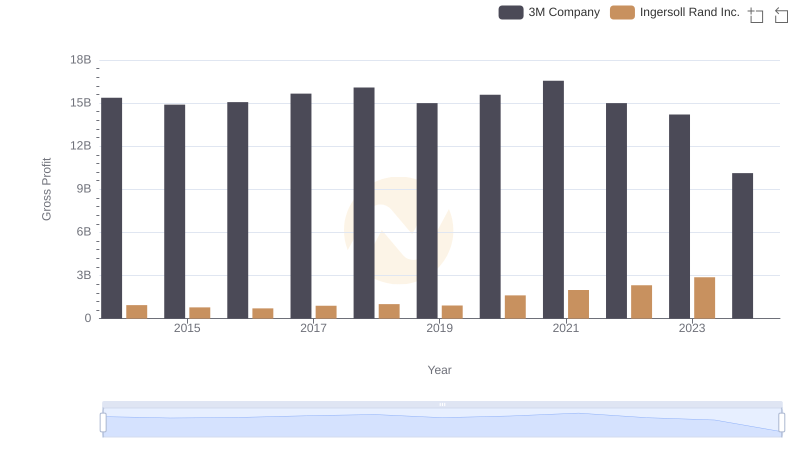
Gross Profit Comparison: 3M Company and Ingersoll Rand Inc. Trends

Key Insights on Gross Profit: 3M Company vs Equifax Inc.
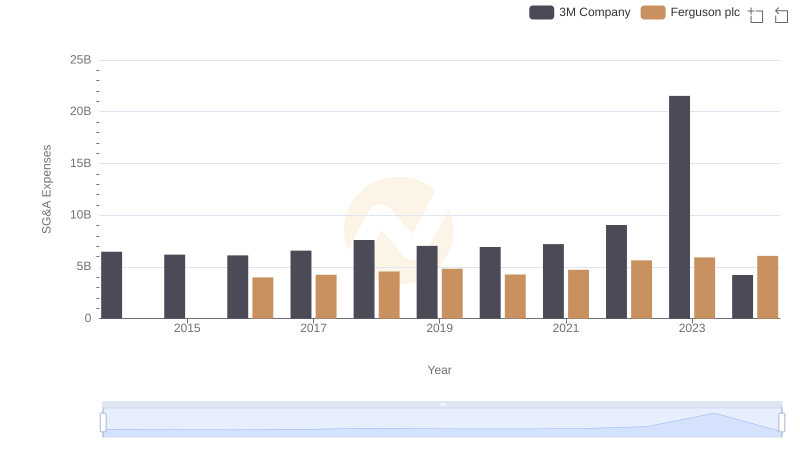
3M Company or Ferguson plc: Who Manages SG&A Costs Better?
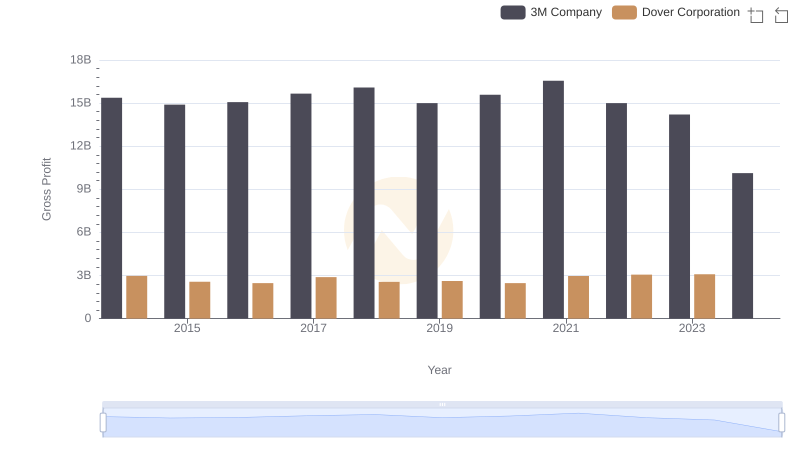
Gross Profit Comparison: 3M Company and Dover Corporation Trends
Key Insights on Gross Profit: 3M Company vs HEICO Corporation