| __timestamp | Masco Corporation | Waste Connections, Inc. |
|---|---|---|
| Wednesday, January 1, 2014 | 6134000000 | 1138388000 |
| Thursday, January 1, 2015 | 4889000000 | 1177409000 |
| Friday, January 1, 2016 | 4901000000 | 1957712000 |
| Sunday, January 1, 2017 | 5033000000 | 2704775000 |
| Monday, January 1, 2018 | 5670000000 | 2865704000 |
| Tuesday, January 1, 2019 | 4336000000 | 3198757000 |
| Wednesday, January 1, 2020 | 4601000000 | 3276808000 |
| Friday, January 1, 2021 | 5512000000 | 3654074000 |
| Saturday, January 1, 2022 | 5967000000 | 4336012000 |
| Sunday, January 1, 2023 | 5131000000 | 4744513000 |
| Monday, January 1, 2024 | 4997000000 | 5191706000 |
Unlocking the unknown
In the ever-evolving landscape of American industry, Waste Connections, Inc. and Masco Corporation stand as titans in their respective fields. Over the past decade, from 2014 to 2023, these companies have showcased contrasting trajectories in their cost of revenue.
Masco Corporation, a leader in home improvement and building products, experienced a notable fluctuation. Starting at a high in 2014, their cost of revenue saw a dip in 2015, followed by a steady climb, peaking in 2022 with a 37% increase from their 2015 low.
Conversely, Waste Connections, Inc., a major player in waste management, demonstrated a consistent upward trend. From 2014 to 2023, their cost of revenue surged by over 300%, reflecting their aggressive expansion and operational efficiency.
This comparison not only highlights the dynamic nature of these industries but also underscores the strategic decisions that drive financial outcomes.
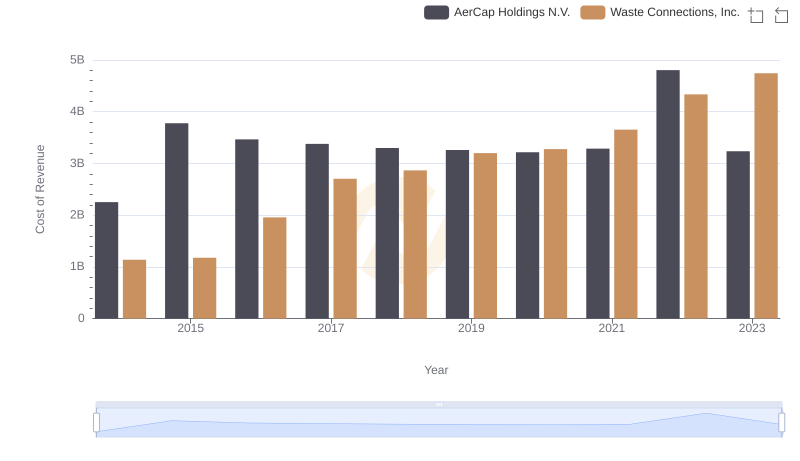
Cost Insights: Breaking Down Waste Connections, Inc. and AerCap Holdings N.V.'s Expenses
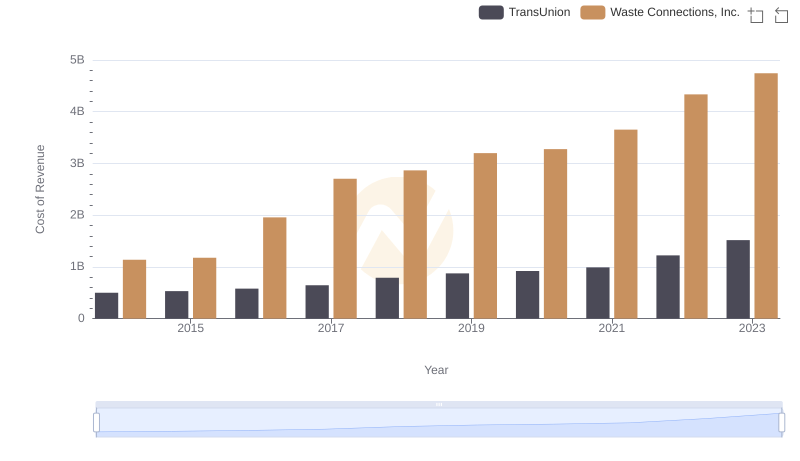
Cost of Revenue Comparison: Waste Connections, Inc. vs TransUnion
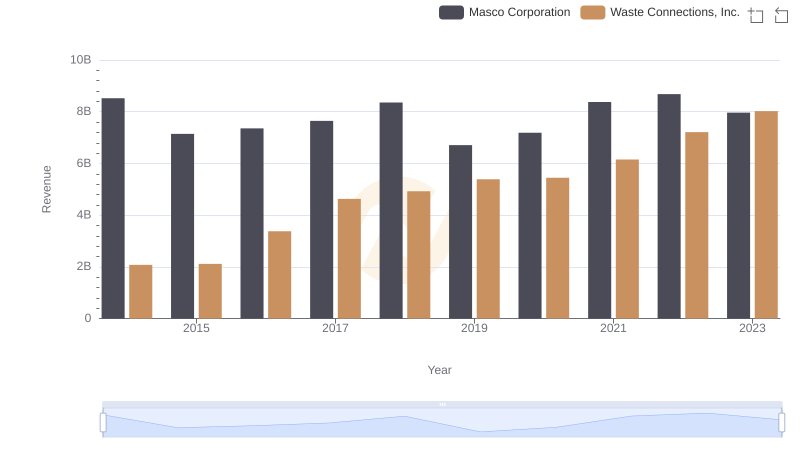
Comparing Revenue Performance: Waste Connections, Inc. or Masco Corporation?
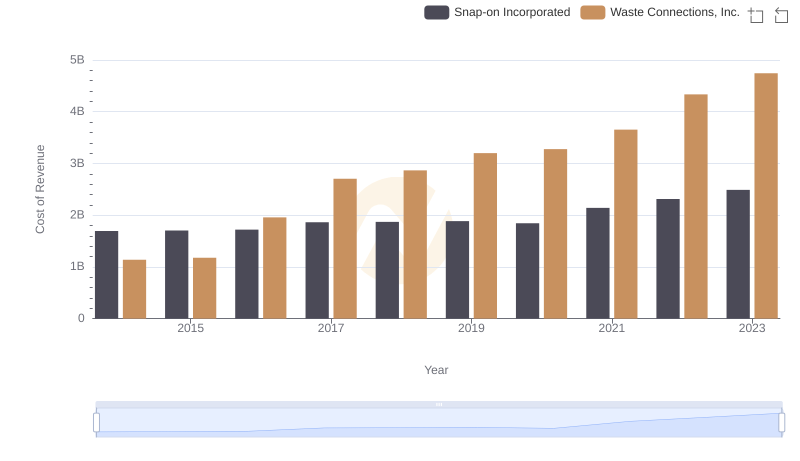
Waste Connections, Inc. vs Snap-on Incorporated: Efficiency in Cost of Revenue Explored
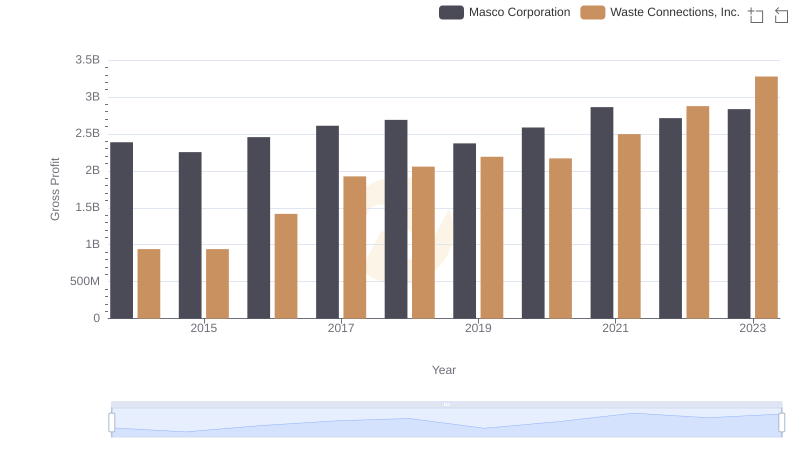
Gross Profit Trends Compared: Waste Connections, Inc. vs Masco Corporation
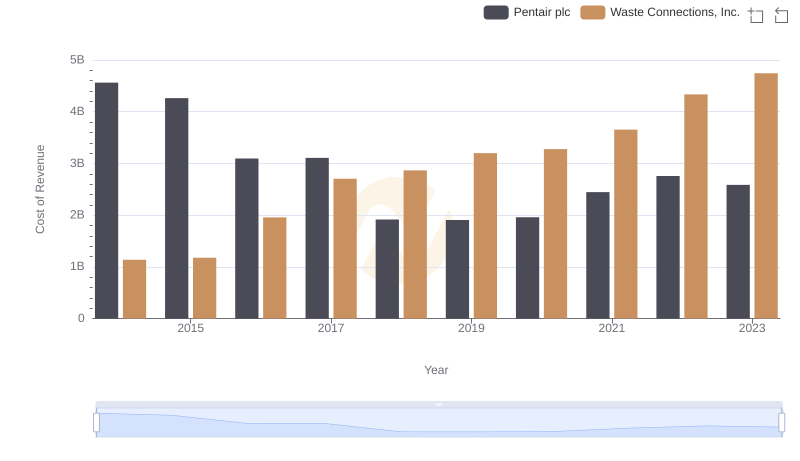
Cost of Revenue Comparison: Waste Connections, Inc. vs Pentair plc
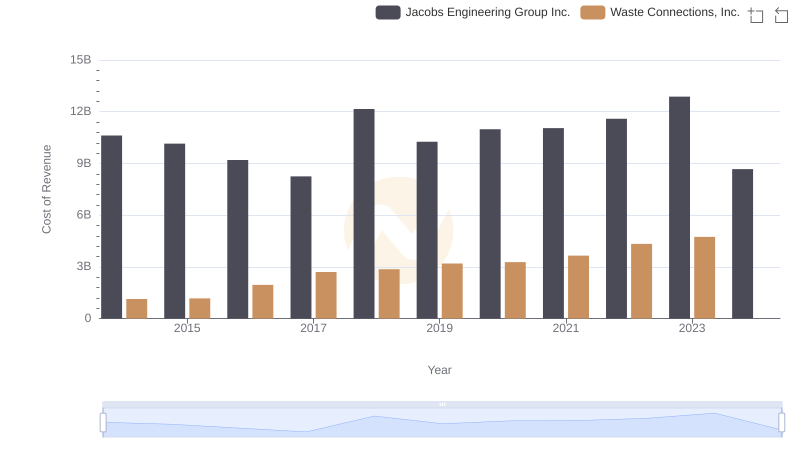
Cost Insights: Breaking Down Waste Connections, Inc. and Jacobs Engineering Group Inc.'s Expenses
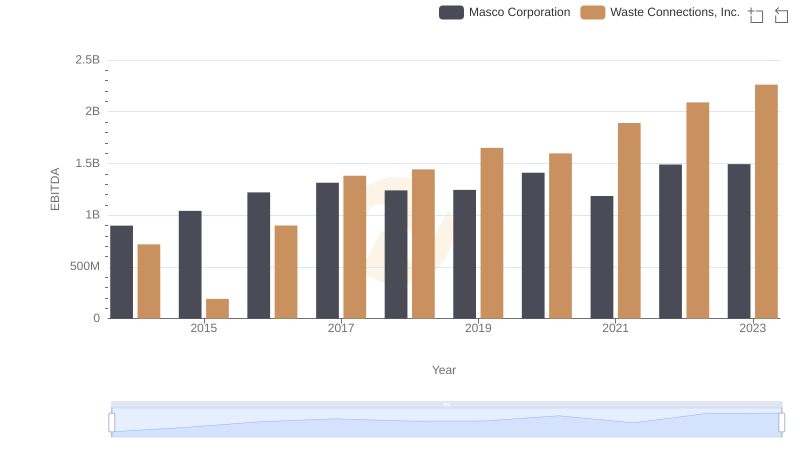
Comparative EBITDA Analysis: Waste Connections, Inc. vs Masco Corporation