| __timestamp | Quanta Services, Inc. | Union Pacific Corporation |
|---|---|---|
| Wednesday, January 1, 2014 | 1233520000 | 9677000000 |
| Thursday, January 1, 2015 | 923665000 | 8976000000 |
| Friday, January 1, 2016 | 1013800000 | 8269000000 |
| Sunday, January 1, 2017 | 1241860000 | 9009000000 |
| Monday, January 1, 2018 | 1479964000 | 9539000000 |
| Tuesday, January 1, 2019 | 1600252000 | 9614000000 |
| Wednesday, January 1, 2020 | 1660847000 | 9179000000 |
| Friday, January 1, 2021 | 1953259000 | 10514000000 |
| Saturday, January 1, 2022 | 2529155000 | 11205000000 |
| Sunday, January 1, 2023 | 2937086000 | 10529000000 |
| Monday, January 1, 2024 | 11039000000 |
Cracking the code
In the ever-evolving landscape of American industry, Union Pacific Corporation and Quanta Services, Inc. stand as titans in their respective fields. Over the past decade, from 2014 to 2023, these companies have showcased distinct trajectories in gross profit growth. Union Pacific, a stalwart in the transportation sector, consistently reported robust profits, peaking in 2022 with a 12% increase from 2014. Meanwhile, Quanta Services, a leader in infrastructure solutions, demonstrated remarkable growth, with a staggering 138% rise in gross profit over the same period. This growth trajectory highlights Quanta's strategic expansion and adaptation to market demands. Notably, 2023 saw Quanta's gross profit reaching nearly 3 billion, a testament to its dynamic growth strategy. However, data for 2024 remains incomplete, leaving room for speculation on future trends. As these giants continue to evolve, their financial narratives offer valuable insights into the broader economic landscape.
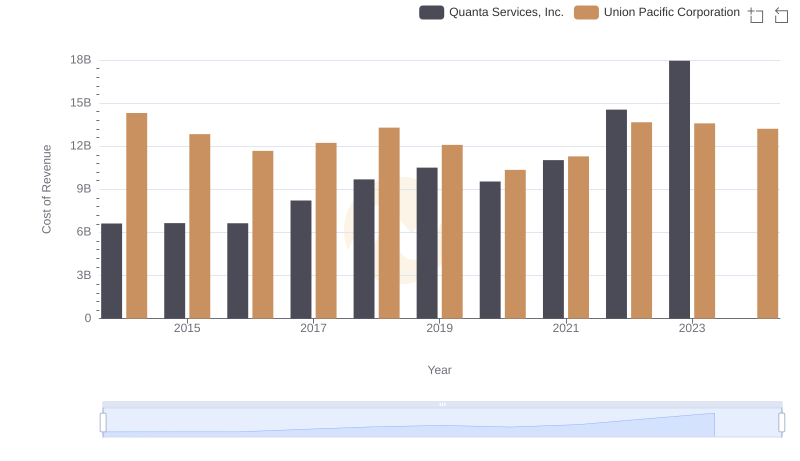
Cost of Revenue: Key Insights for Union Pacific Corporation and Quanta Services, Inc.
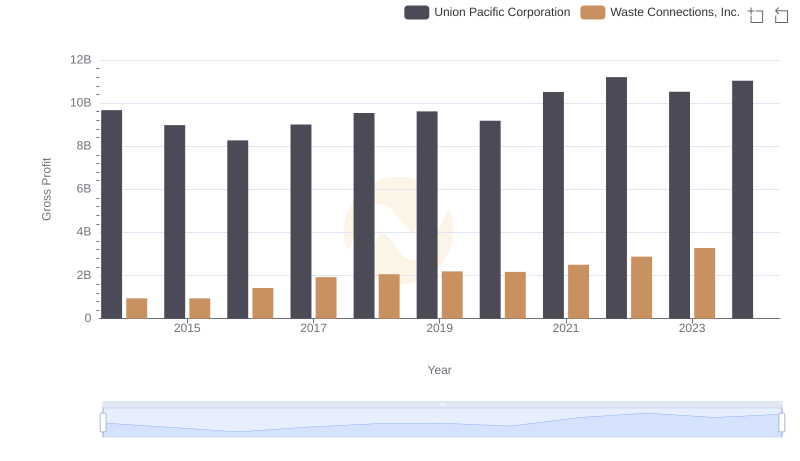
Gross Profit Analysis: Comparing Union Pacific Corporation and Waste Connections, Inc.
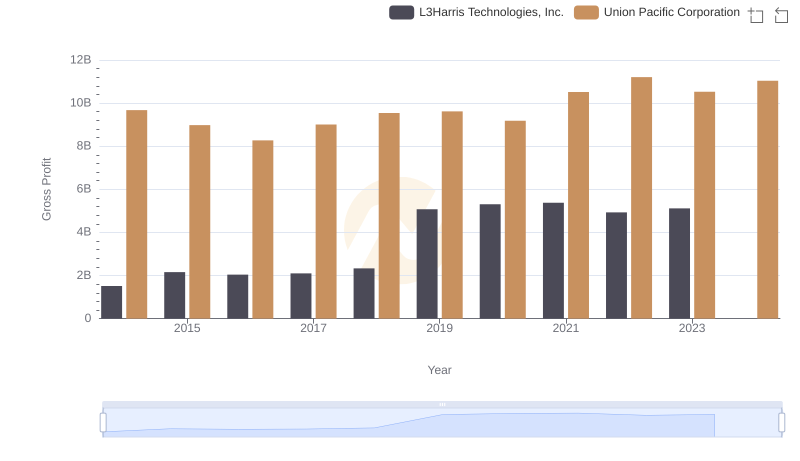
Key Insights on Gross Profit: Union Pacific Corporation vs L3Harris Technologies, Inc.
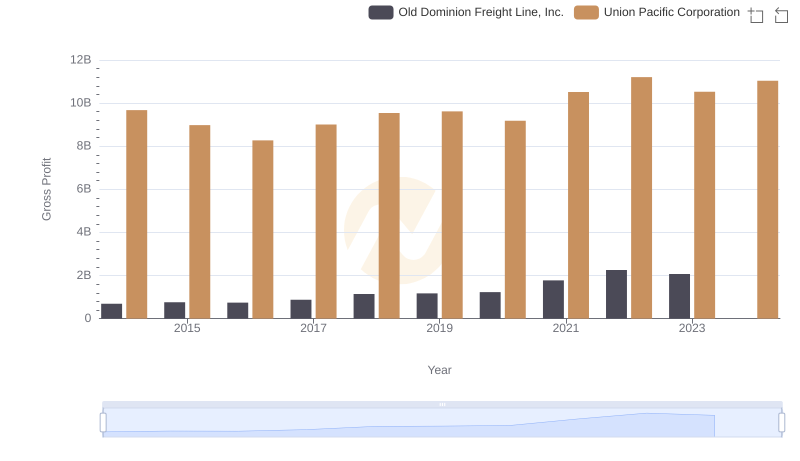
Who Generates Higher Gross Profit? Union Pacific Corporation or Old Dominion Freight Line, Inc.
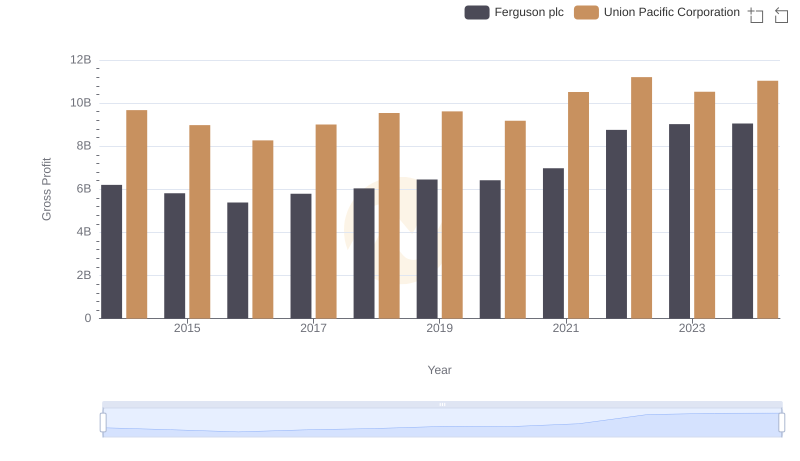
Union Pacific Corporation vs Ferguson plc: A Gross Profit Performance Breakdown
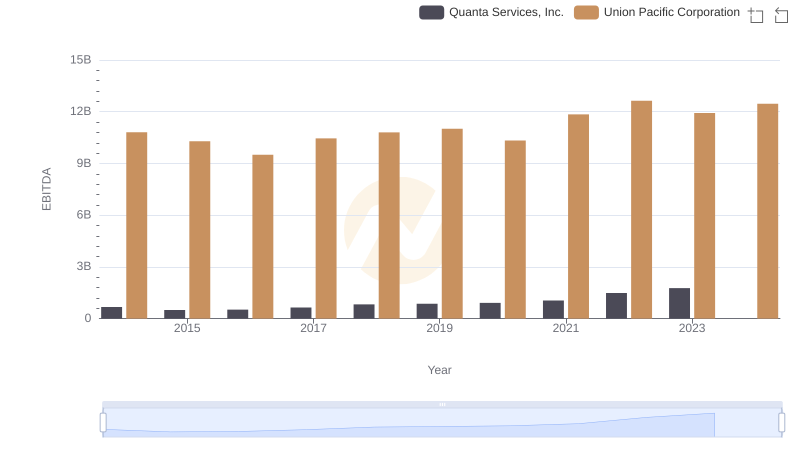
A Side-by-Side Analysis of EBITDA: Union Pacific Corporation and Quanta Services, Inc.