| __timestamp | Quanta Services, Inc. | Union Pacific Corporation |
|---|---|---|
| Wednesday, January 1, 2014 | 671899000 | 10808000000 |
| Thursday, January 1, 2015 | 497247000 | 10290000000 |
| Friday, January 1, 2016 | 524498000 | 9502000000 |
| Sunday, January 1, 2017 | 647748000 | 10456000000 |
| Monday, January 1, 2018 | 824909000 | 10802000000 |
| Tuesday, January 1, 2019 | 862368000 | 11013000000 |
| Wednesday, January 1, 2020 | 911029000 | 10331000000 |
| Friday, January 1, 2021 | 1052832000 | 11843000000 |
| Saturday, January 1, 2022 | 1483091000 | 12636000000 |
| Sunday, January 1, 2023 | 1770669000 | 11928000000 |
| Monday, January 1, 2024 | 12461000000 |
Unleashing the power of data
In the ever-evolving landscape of American industry, Union Pacific Corporation and Quanta Services, Inc. stand as titans in their respective fields. Over the past decade, Union Pacific has consistently demonstrated robust financial health, with its EBITDA peaking at approximately $12.6 billion in 2022, marking a 33% increase from 2016. Meanwhile, Quanta Services has shown remarkable growth, with its EBITDA surging by over 200% from 2014 to 2023, reaching nearly $1.8 billion.
This side-by-side analysis reveals Union Pacific's steady dominance, yet highlights Quanta's impressive upward trajectory. The data from 2024 is incomplete, but the trends suggest continued competition. As these giants navigate the complexities of their industries, investors and analysts alike will be keenly observing their financial maneuvers. This chart offers a snapshot of their financial journeys, providing valuable insights into their strategic directions.
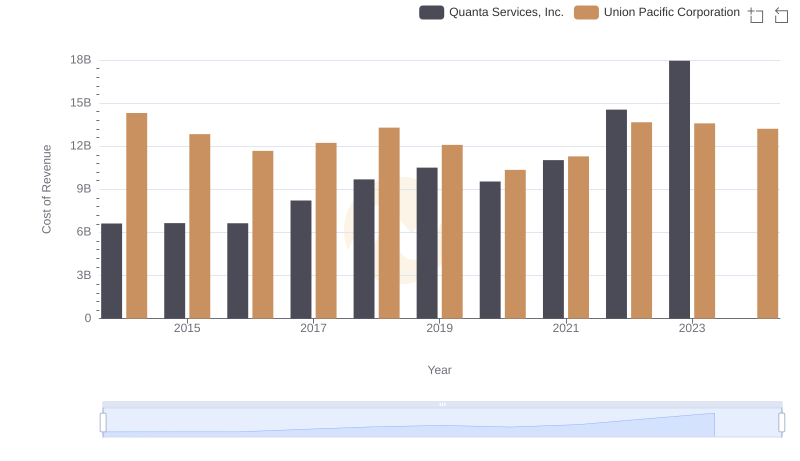
Cost of Revenue: Key Insights for Union Pacific Corporation and Quanta Services, Inc.
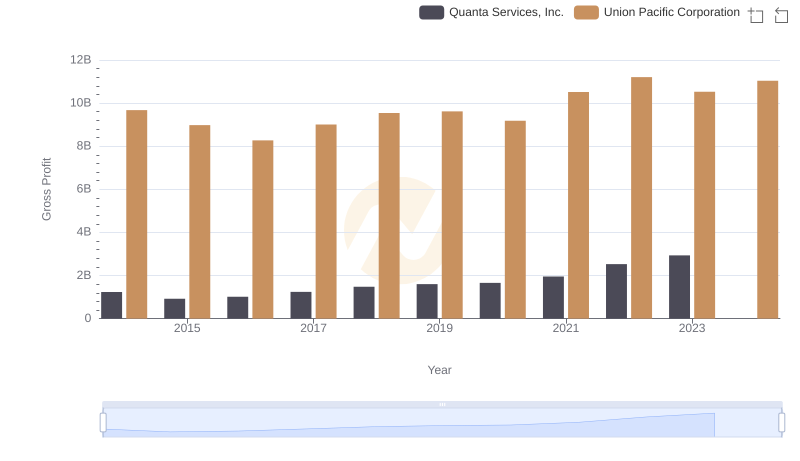
Gross Profit Trends Compared: Union Pacific Corporation vs Quanta Services, Inc.
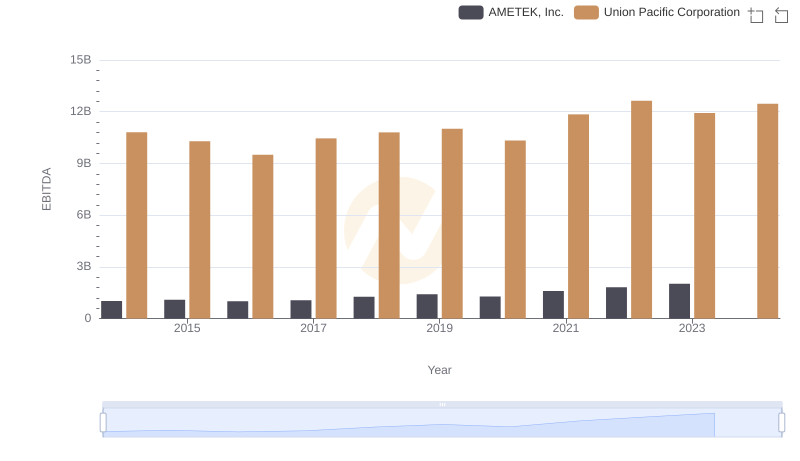
EBITDA Performance Review: Union Pacific Corporation vs AMETEK, Inc.
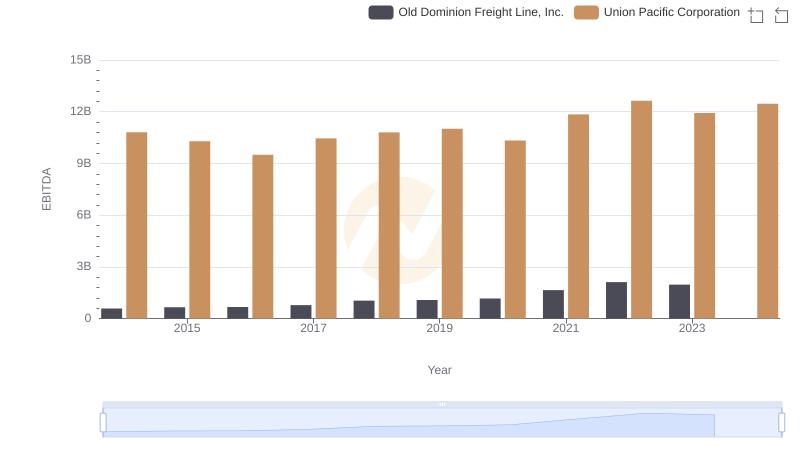
EBITDA Analysis: Evaluating Union Pacific Corporation Against Old Dominion Freight Line, Inc.

EBITDA Metrics Evaluated: Union Pacific Corporation vs Ferguson plc