| __timestamp | Ferguson plc | Union Pacific Corporation |
|---|---|---|
| Wednesday, January 1, 2014 | 6203188666 | 9677000000 |
| Thursday, January 1, 2015 | 5816457079 | 8976000000 |
| Friday, January 1, 2016 | 5389727937 | 8269000000 |
| Sunday, January 1, 2017 | 5793596551 | 9009000000 |
| Monday, January 1, 2018 | 6044000000 | 9539000000 |
| Tuesday, January 1, 2019 | 6458000000 | 9614000000 |
| Wednesday, January 1, 2020 | 6421000000 | 9179000000 |
| Friday, January 1, 2021 | 6980000000 | 10514000000 |
| Saturday, January 1, 2022 | 8756000000 | 11205000000 |
| Sunday, January 1, 2023 | 9025000000 | 10529000000 |
| Monday, January 1, 2024 | 9053000000 | 11039000000 |
Unleashing the power of data
In the world of industrial titans, Union Pacific Corporation and Ferguson plc stand as formidable players. Over the past decade, from 2014 to 2024, these companies have showcased their prowess in gross profit generation. Union Pacific Corporation, a stalwart in the transportation sector, consistently outperformed Ferguson plc, a leader in the building materials industry, with an average gross profit of approximately $9.8 billion annually. Notably, Union Pacific's gross profit peaked in 2022, reaching a remarkable $11.2 billion, a 35% increase from its lowest point in 2016.
Ferguson plc, while trailing, demonstrated impressive growth, especially in recent years. From 2016 to 2024, Ferguson's gross profit surged by nearly 68%, culminating in a record $9.05 billion in 2024. This performance underscores the resilience and strategic acumen of both companies in navigating economic challenges and capitalizing on market opportunities.

Revenue Insights: Union Pacific Corporation and Ferguson plc Performance Compared
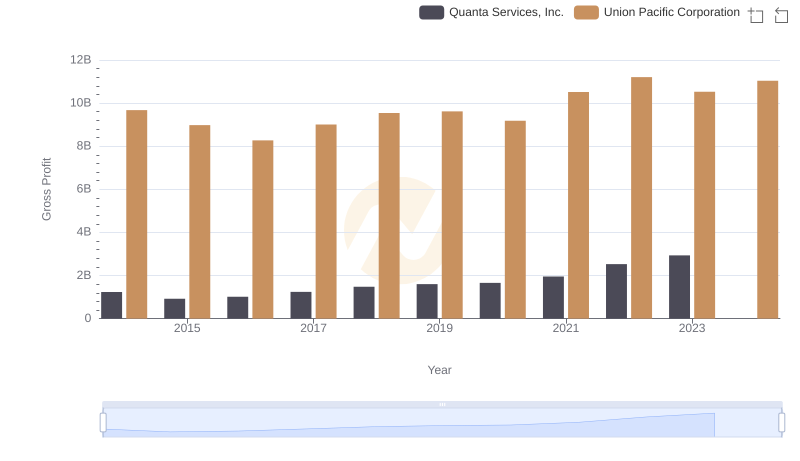
Gross Profit Trends Compared: Union Pacific Corporation vs Quanta Services, Inc.
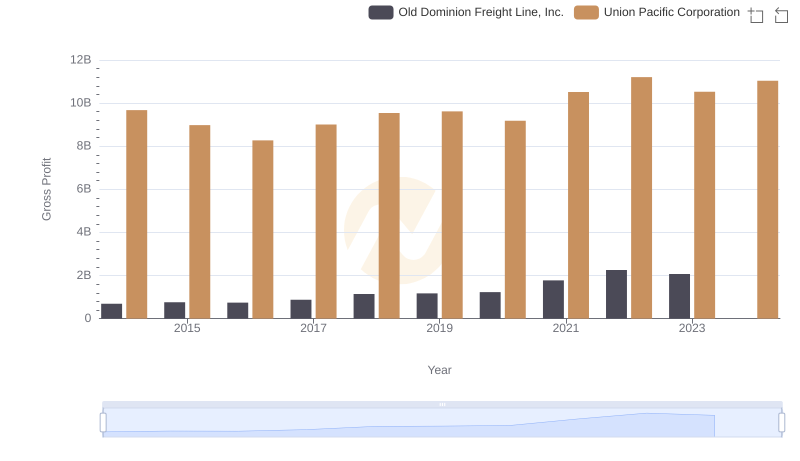
Who Generates Higher Gross Profit? Union Pacific Corporation or Old Dominion Freight Line, Inc.
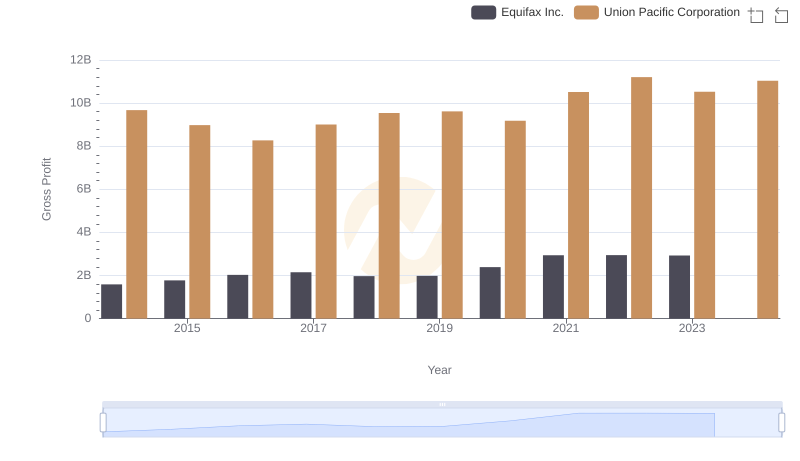
Union Pacific Corporation and Equifax Inc.: A Detailed Gross Profit Analysis

EBITDA Metrics Evaluated: Union Pacific Corporation vs Ferguson plc