| __timestamp | Quanta Services, Inc. | Union Pacific Corporation |
|---|---|---|
| Wednesday, January 1, 2014 | 6617730000 | 14311000000 |
| Thursday, January 1, 2015 | 6648771000 | 12837000000 |
| Friday, January 1, 2016 | 6637519000 | 11672000000 |
| Sunday, January 1, 2017 | 8224618000 | 12231000000 |
| Monday, January 1, 2018 | 9691459000 | 13293000000 |
| Tuesday, January 1, 2019 | 10511901000 | 12094000000 |
| Wednesday, January 1, 2020 | 9541825000 | 10354000000 |
| Friday, January 1, 2021 | 11026954000 | 11290000000 |
| Saturday, January 1, 2022 | 14544748000 | 13670000000 |
| Sunday, January 1, 2023 | 17945120000 | 13590000000 |
| Monday, January 1, 2024 | 13211000000 |
Data in motion
In the ever-evolving landscape of American industry, Union Pacific Corporation and Quanta Services, Inc. stand as titans in their respective fields. From 2014 to 2023, these companies have showcased intriguing trends in their cost of revenue, a critical metric reflecting the direct costs attributable to the production of goods sold by a company.
Union Pacific, a stalwart in the transportation sector, has seen a relatively stable cost of revenue, peaking in 2014 and experiencing a slight decline by 2023. This reflects a strategic focus on efficiency and cost management. Meanwhile, Quanta Services, a leader in infrastructure solutions, has demonstrated a robust growth trajectory, with its cost of revenue surging by approximately 171% over the same period. This increase underscores Quanta's aggressive expansion and investment in new projects.
These insights reveal the dynamic strategies employed by these industry leaders, offering a window into their operational priorities and market positioning.
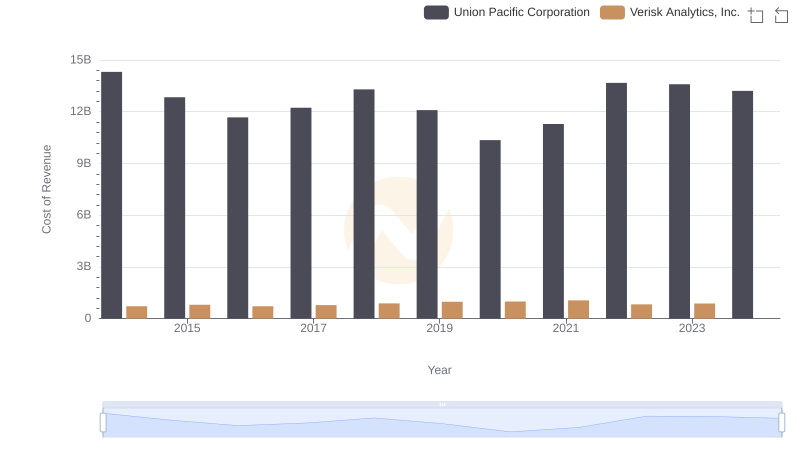
Cost of Revenue Trends: Union Pacific Corporation vs Verisk Analytics, Inc.
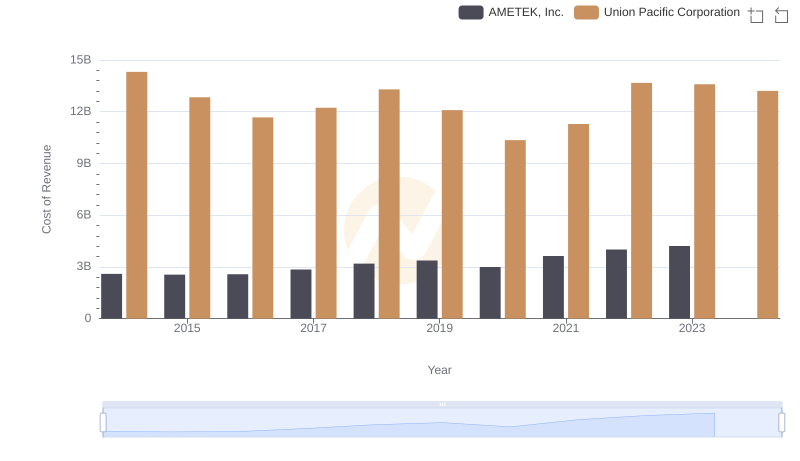
Analyzing Cost of Revenue: Union Pacific Corporation and AMETEK, Inc.
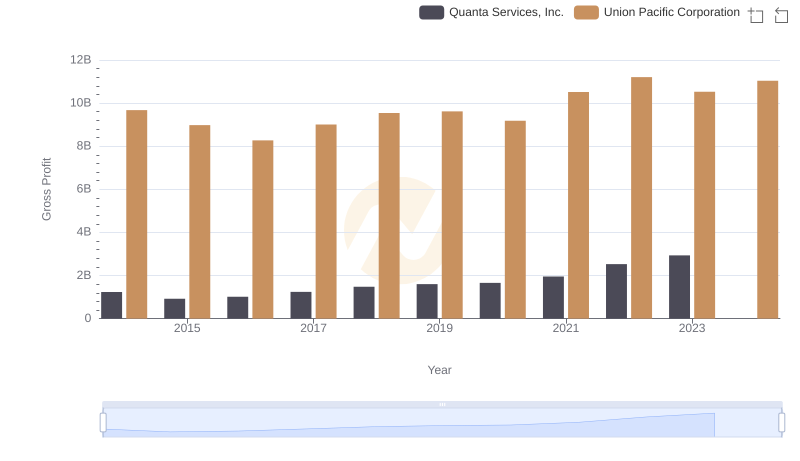
Gross Profit Trends Compared: Union Pacific Corporation vs Quanta Services, Inc.
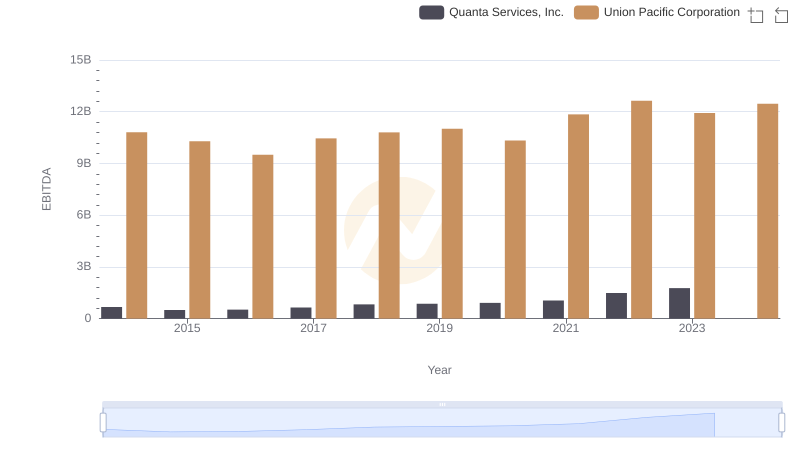
A Side-by-Side Analysis of EBITDA: Union Pacific Corporation and Quanta Services, Inc.