| __timestamp | Old Dominion Freight Line, Inc. | Union Pacific Corporation |
|---|---|---|
| Wednesday, January 1, 2014 | 687488000 | 9677000000 |
| Thursday, January 1, 2015 | 757499000 | 8976000000 |
| Friday, January 1, 2016 | 744627000 | 8269000000 |
| Sunday, January 1, 2017 | 875380000 | 9009000000 |
| Monday, January 1, 2018 | 1144243000 | 9539000000 |
| Tuesday, January 1, 2019 | 1170216000 | 9614000000 |
| Wednesday, January 1, 2020 | 1228598000 | 9179000000 |
| Friday, January 1, 2021 | 1775060000 | 10514000000 |
| Saturday, January 1, 2022 | 2256126000 | 11205000000 |
| Sunday, January 1, 2023 | 2072199000 | 10529000000 |
| Monday, January 1, 2024 | 11039000000 |
Unleashing the power of data
In the world of freight transportation, Union Pacific Corporation and Old Dominion Freight Line, Inc. stand as titans. Over the past decade, Union Pacific has consistently outperformed Old Dominion in terms of gross profit, boasting figures that are approximately 8 to 10 times higher. For instance, in 2022, Union Pacific's gross profit reached an impressive $11.2 billion, while Old Dominion's was $2.3 billion. This trend highlights Union Pacific's dominant position in the industry.
However, Old Dominion has shown remarkable growth, with its gross profit increasing by over 200% from 2014 to 2022. This growth trajectory suggests a promising future for the company. Despite missing data for 2024, Union Pacific's continued upward trend suggests it remains a formidable force. As these companies navigate the evolving landscape of freight transportation, their financial performances offer valuable insights into their strategic directions.
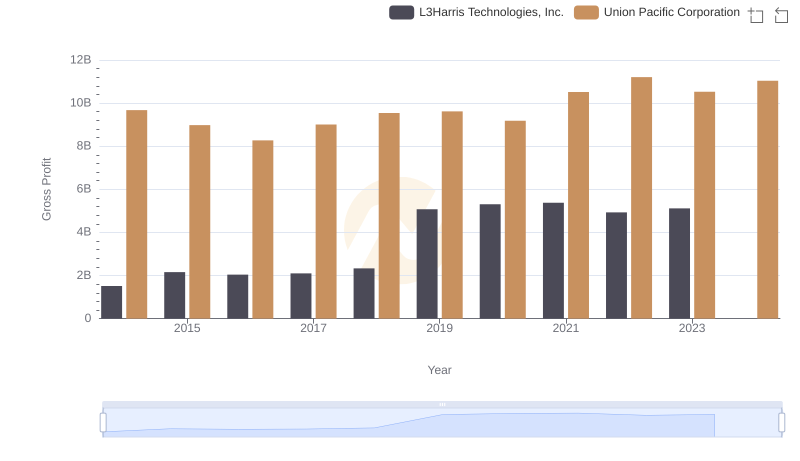
Key Insights on Gross Profit: Union Pacific Corporation vs L3Harris Technologies, Inc.
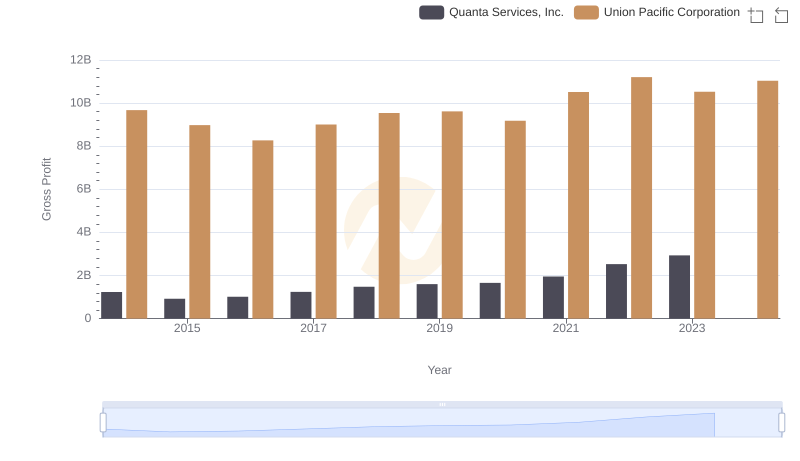
Gross Profit Trends Compared: Union Pacific Corporation vs Quanta Services, Inc.
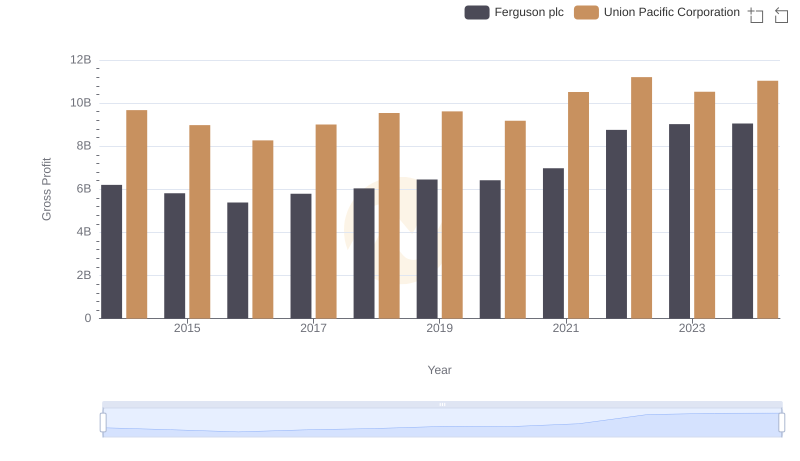
Union Pacific Corporation vs Ferguson plc: A Gross Profit Performance Breakdown
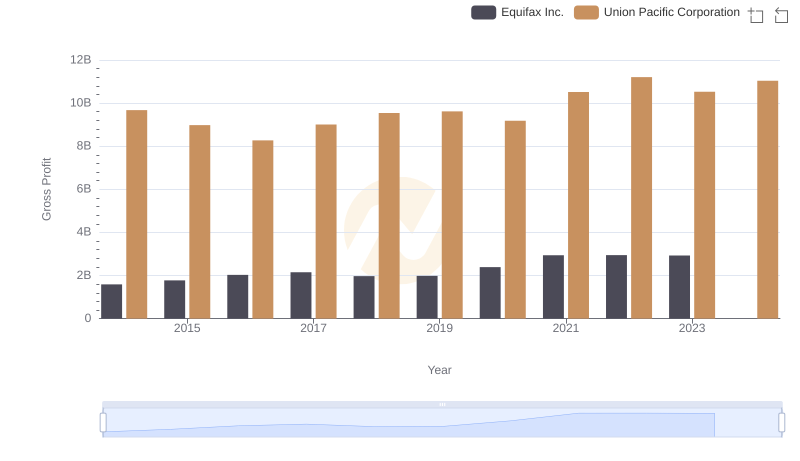
Union Pacific Corporation and Equifax Inc.: A Detailed Gross Profit Analysis
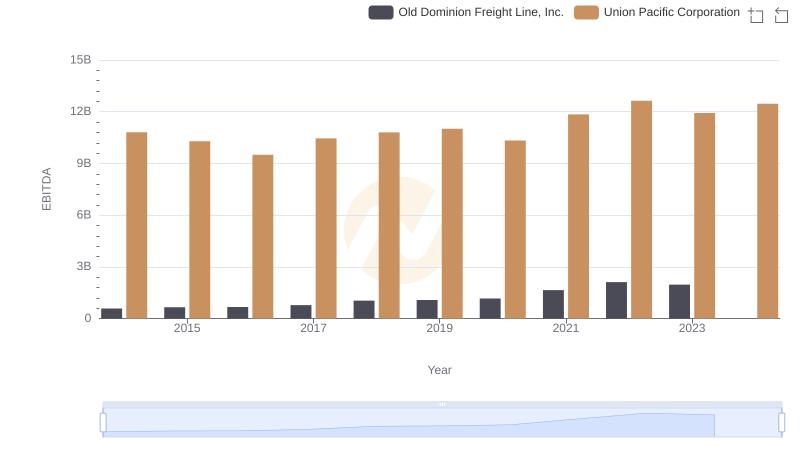
EBITDA Analysis: Evaluating Union Pacific Corporation Against Old Dominion Freight Line, Inc.