| __timestamp | Parker-Hannifin Corporation | Roper Technologies, Inc. |
|---|---|---|
| Wednesday, January 1, 2014 | 3027744000 | 2101899000 |
| Thursday, January 1, 2015 | 3056499000 | 2164646000 |
| Friday, January 1, 2016 | 2537369000 | 2332410000 |
| Sunday, January 1, 2017 | 2840350000 | 2864796000 |
| Monday, January 1, 2018 | 3539551000 | 3279500000 |
| Tuesday, January 1, 2019 | 3616840000 | 3427100000 |
| Wednesday, January 1, 2020 | 3409002000 | 3543000000 |
| Friday, January 1, 2021 | 3897960000 | 3917400000 |
| Saturday, January 1, 2022 | 4474341000 | 3752800000 |
| Sunday, January 1, 2023 | 6429302000 | 4307200000 |
| Monday, January 1, 2024 | 7127790000 | 4878300000 |
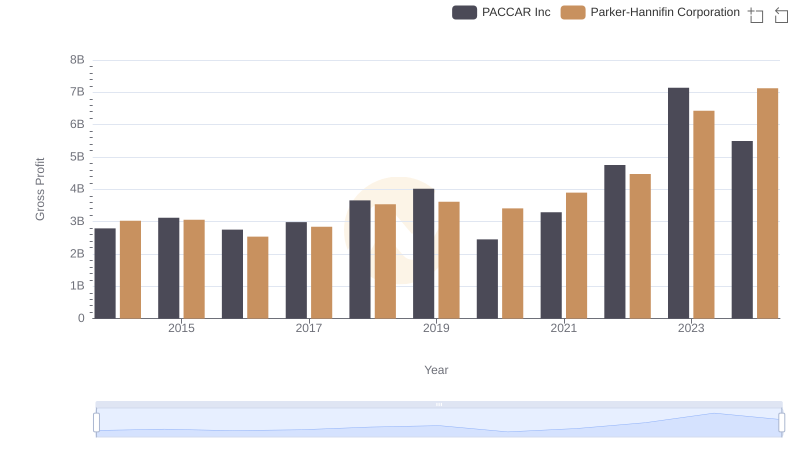
Data in motion
In the competitive landscape of industrial manufacturing, Parker-Hannifin Corporation and Roper Technologies, Inc. have been key players. Over the past decade, Parker-Hannifin has demonstrated a remarkable growth trajectory in gross profit, surging by approximately 135% from 2014 to 2023. In contrast, Roper Technologies experienced a steady increase of around 105% over the same period.
The data highlights Parker-Hannifin's aggressive expansion strategy, while Roper's steady growth reflects its focus on sustainable profitability. Missing data for 2024 suggests a need for further analysis to understand future trends.

Breaking Down Revenue Trends: Parker-Hannifin Corporation vs Roper Technologies, Inc.
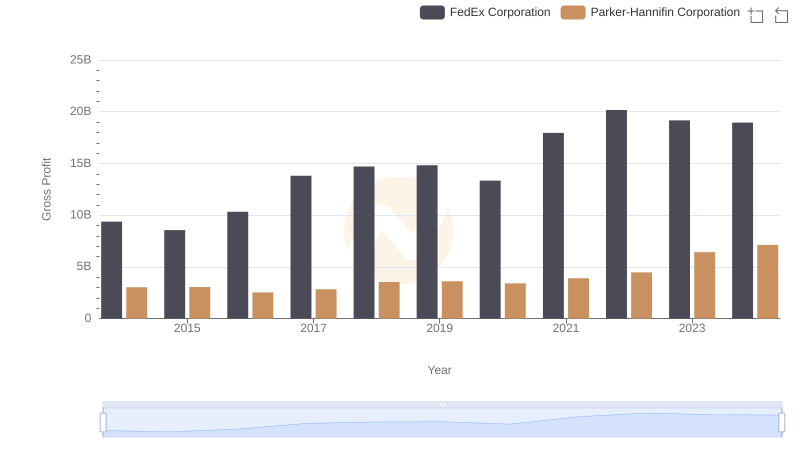
Gross Profit Comparison: Parker-Hannifin Corporation and FedEx Corporation Trends
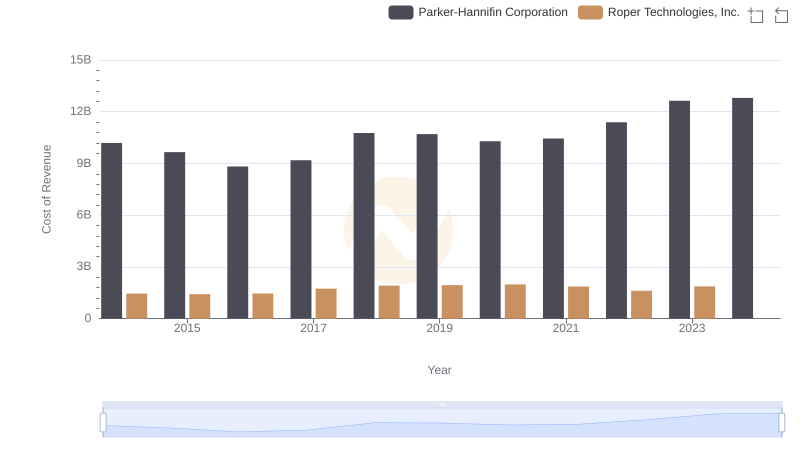
Cost Insights: Breaking Down Parker-Hannifin Corporation and Roper Technologies, Inc.'s Expenses

Gross Profit Trends Compared: Parker-Hannifin Corporation vs Republic Services, Inc.

Parker-Hannifin Corporation vs CSX Corporation: A Gross Profit Performance Breakdown
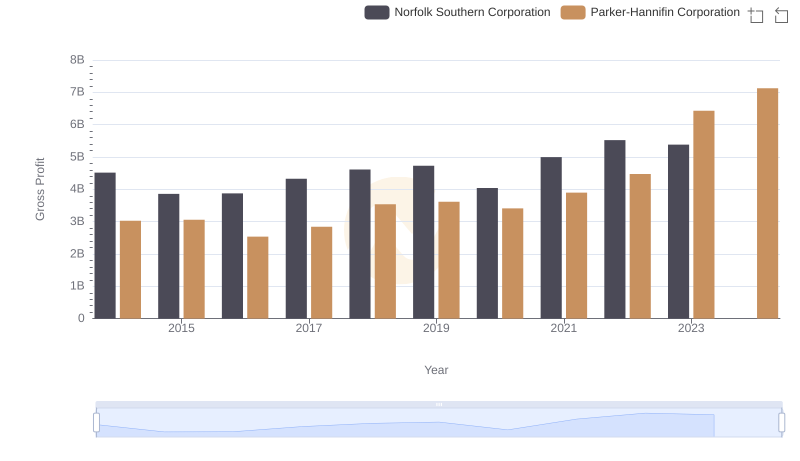
Who Generates Higher Gross Profit? Parker-Hannifin Corporation or Norfolk Southern Corporation
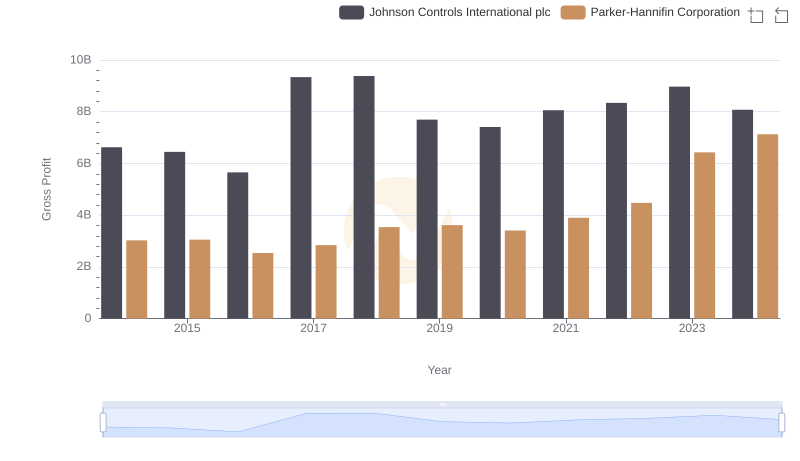
Gross Profit Comparison: Parker-Hannifin Corporation and Johnson Controls International plc Trends
Key Insights on Gross Profit: Parker-Hannifin Corporation vs PACCAR Inc
R&D Spending Showdown: Parker-Hannifin Corporation vs Roper Technologies, Inc.

Parker-Hannifin Corporation and Roper Technologies, Inc.: SG&A Spending Patterns Compared

EBITDA Metrics Evaluated: Parker-Hannifin Corporation vs Roper Technologies, Inc.