| __timestamp | PACCAR Inc | Parker-Hannifin Corporation |
|---|---|---|
| Wednesday, January 1, 2014 | 2793200000 | 3027744000 |
| Thursday, January 1, 2015 | 3121300000 | 3056499000 |
| Friday, January 1, 2016 | 2753200000 | 2537369000 |
| Sunday, January 1, 2017 | 2985600000 | 2840350000 |
| Monday, January 1, 2018 | 3655800000 | 3539551000 |
| Tuesday, January 1, 2019 | 4015400000 | 3616840000 |
| Wednesday, January 1, 2020 | 2452000000 | 3409002000 |
| Friday, January 1, 2021 | 3291900000 | 3897960000 |
| Saturday, January 1, 2022 | 4751600000 | 4474341000 |
| Sunday, January 1, 2023 | 7141900000 | 6429302000 |
| Monday, January 1, 2024 | 5494700000 | 7127790000 |
Unleashing insights
In the competitive landscape of industrial manufacturing, Parker-Hannifin Corporation and PACCAR Inc have been pivotal players. Over the past decade, from 2014 to 2024, these giants have showcased intriguing trends in their gross profits. Parker-Hannifin, known for its motion and control technologies, saw a steady rise in gross profit, peaking in 2024 with a remarkable 7.13 billion USD. This represents a growth of over 135% from its 2016 low. Meanwhile, PACCAR, a leader in the design and manufacture of premium trucks, experienced a significant surge in 2023, reaching 7.14 billion USD, a 160% increase from its 2020 dip. These trends highlight the resilience and strategic prowess of both companies in navigating economic challenges and capitalizing on market opportunities. As we look to the future, the data suggests a promising trajectory for both corporations, underscoring their pivotal roles in the industrial sector.
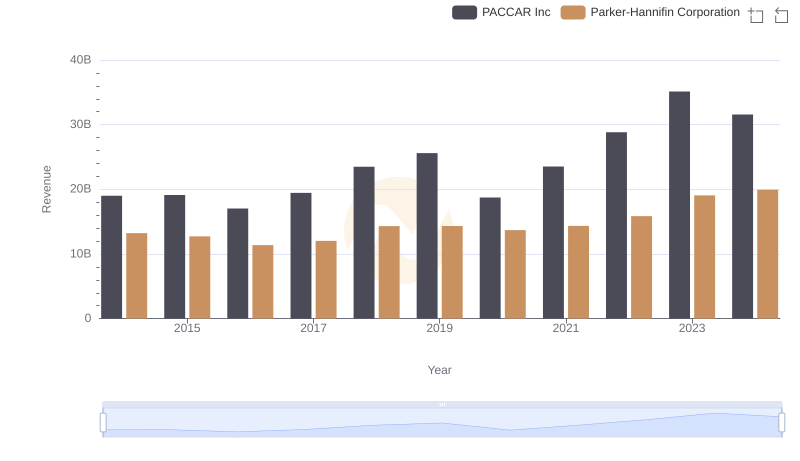
Comparing Revenue Performance: Parker-Hannifin Corporation or PACCAR Inc?

Parker-Hannifin Corporation vs Roper Technologies, Inc.: A Gross Profit Performance Breakdown
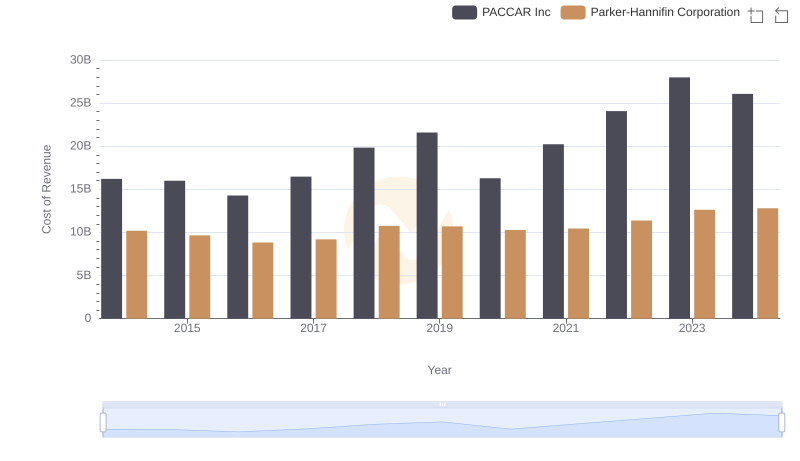
Comparing Cost of Revenue Efficiency: Parker-Hannifin Corporation vs PACCAR Inc
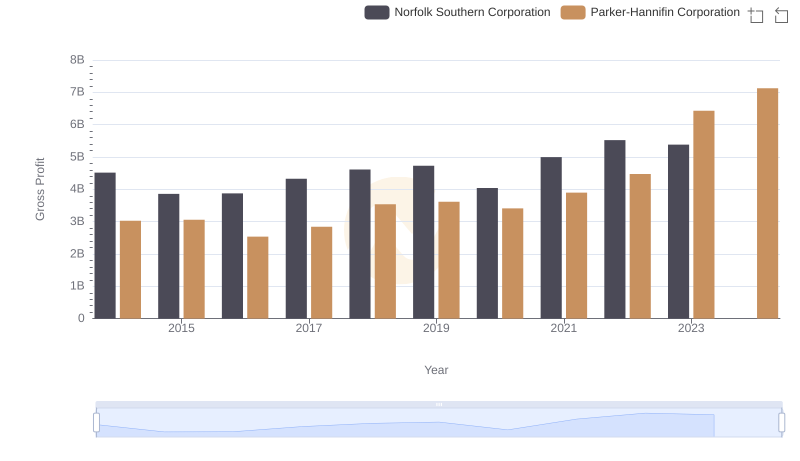
Who Generates Higher Gross Profit? Parker-Hannifin Corporation or Norfolk Southern Corporation
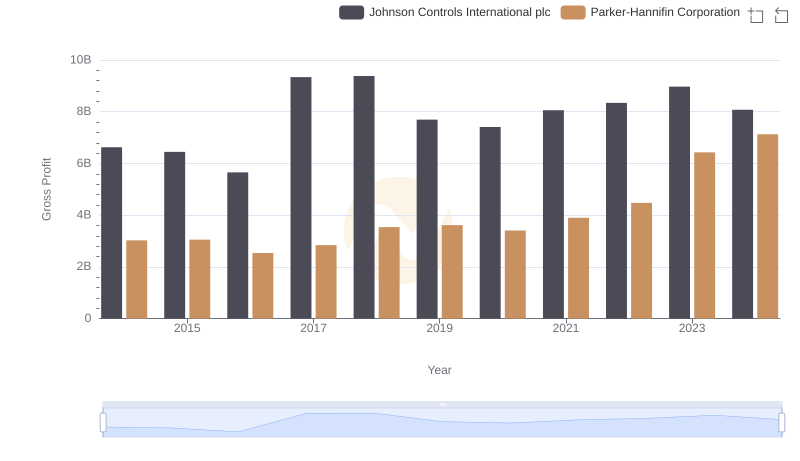
Gross Profit Comparison: Parker-Hannifin Corporation and Johnson Controls International plc Trends
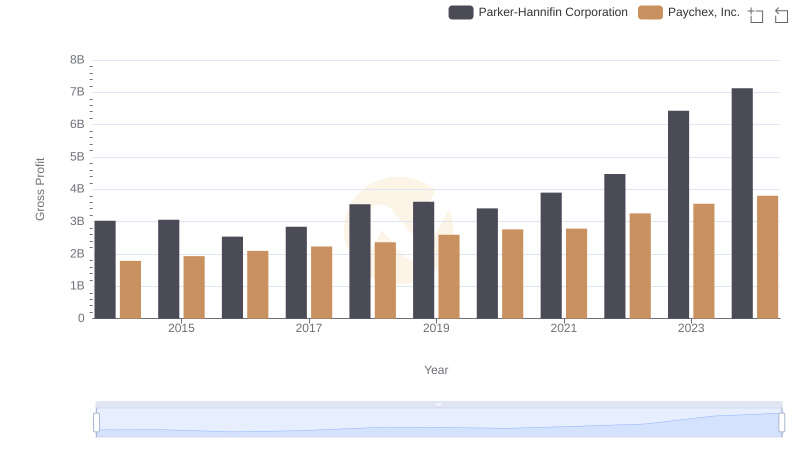
Who Generates Higher Gross Profit? Parker-Hannifin Corporation or Paychex, Inc.
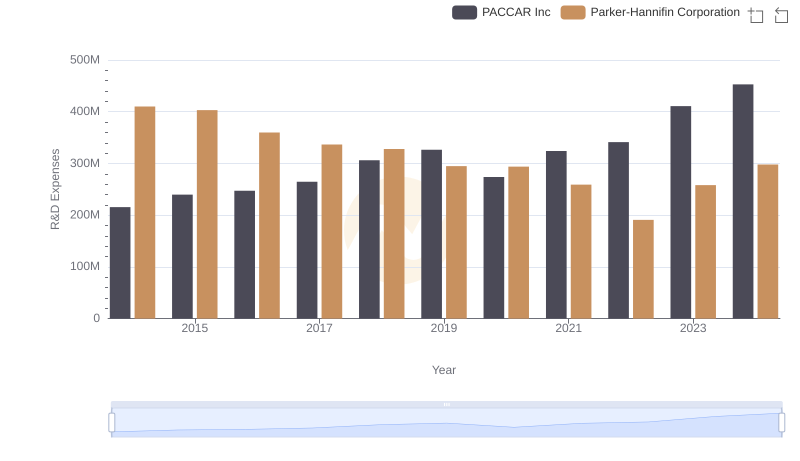
Parker-Hannifin Corporation vs PACCAR Inc: Strategic Focus on R&D Spending
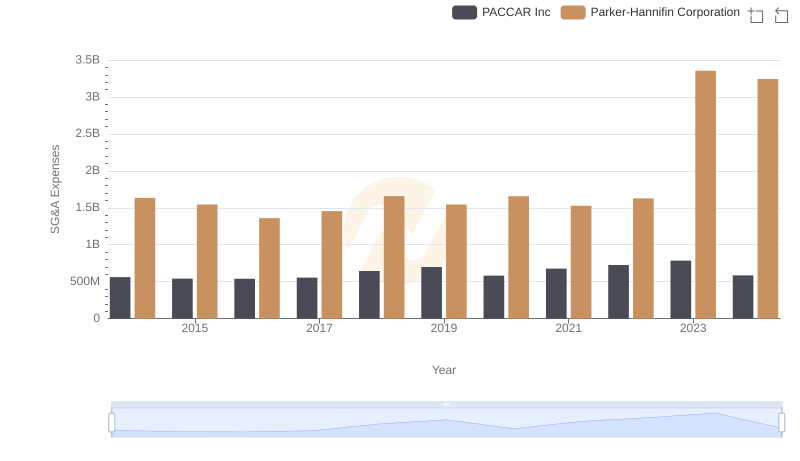
Selling, General, and Administrative Costs: Parker-Hannifin Corporation vs PACCAR Inc