| __timestamp | Ingersoll Rand Inc. | TransUnion |
|---|---|---|
| Wednesday, January 1, 2014 | 936781000 | 805600000 |
| Thursday, January 1, 2015 | 779100000 | 975200000 |
| Friday, January 1, 2016 | 716731000 | 1125800000 |
| Sunday, January 1, 2017 | 897900000 | 1288100000 |
| Monday, January 1, 2018 | 1012500000 | 1527100000 |
| Tuesday, January 1, 2019 | 911700000 | 1782000000 |
| Wednesday, January 1, 2020 | 1613400000 | 1796200000 |
| Friday, January 1, 2021 | 1988500000 | 1968600000 |
| Saturday, January 1, 2022 | 2325600000 | 2487000000 |
| Sunday, January 1, 2023 | 2882200000 | 2313900000 |
| Monday, January 1, 2024 | 0 | 4183800000 |
Unleashing insights
In the ever-evolving landscape of American industry, Ingersoll Rand Inc. and TransUnion have emerged as titans in their respective fields. Over the past decade, these companies have demonstrated remarkable growth in gross profit, with Ingersoll Rand Inc. experiencing a staggering 207% increase from 2014 to 2023. Meanwhile, TransUnion has seen its gross profit soar by approximately 187% during the same period.
Ingersoll Rand Inc., a leader in industrial manufacturing, has consistently outpaced its competitor, peaking in 2023 with a gross profit nearly 25% higher than TransUnion. On the other hand, TransUnion, a credit reporting agency, has shown steady growth, reaching its zenith in 2022. This analysis highlights the resilience and adaptability of these companies, offering valuable insights into their strategic maneuvers in a competitive market.
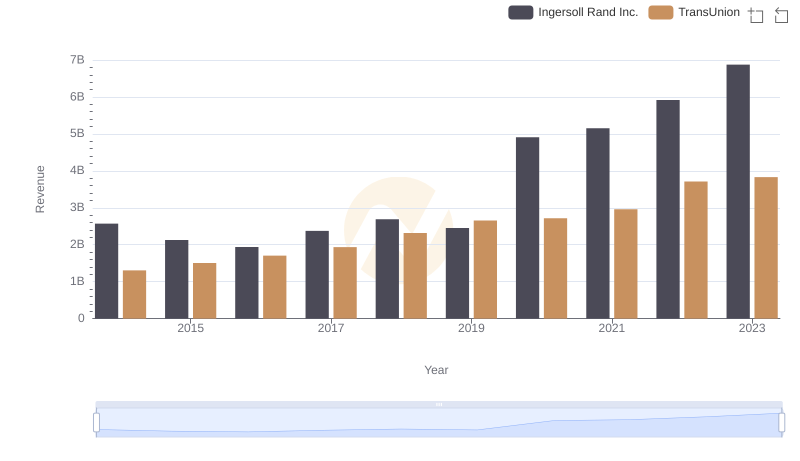
Ingersoll Rand Inc. vs TransUnion: Annual Revenue Growth Compared
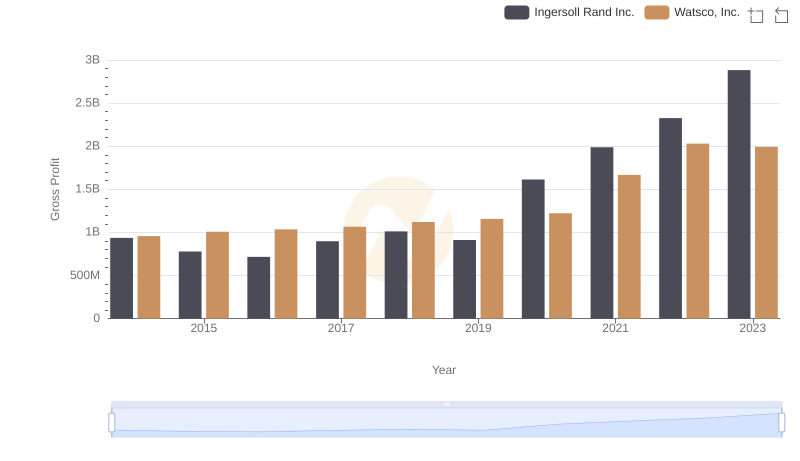
Gross Profit Comparison: Ingersoll Rand Inc. and Watsco, Inc. Trends
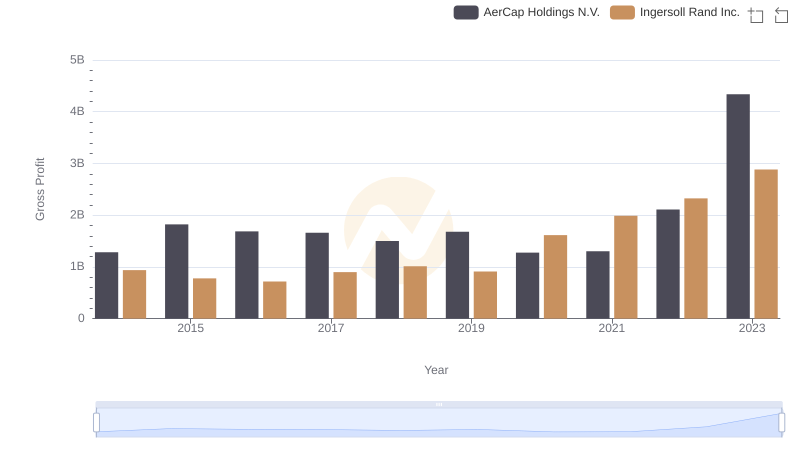
Gross Profit Comparison: Ingersoll Rand Inc. and AerCap Holdings N.V. Trends
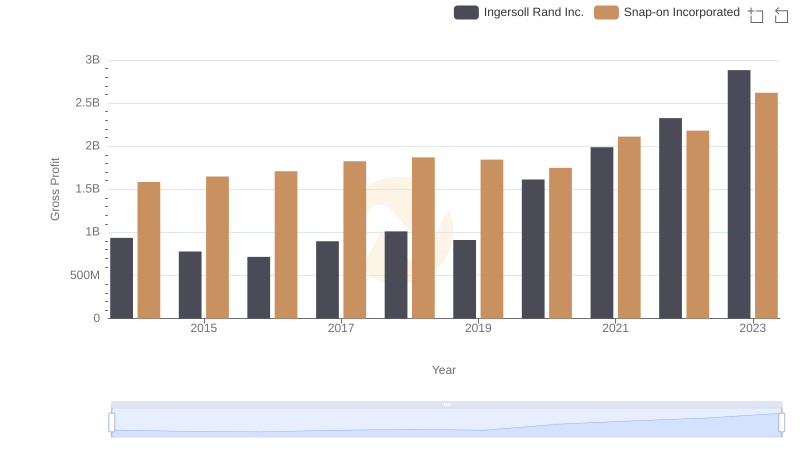
Key Insights on Gross Profit: Ingersoll Rand Inc. vs Snap-on Incorporated
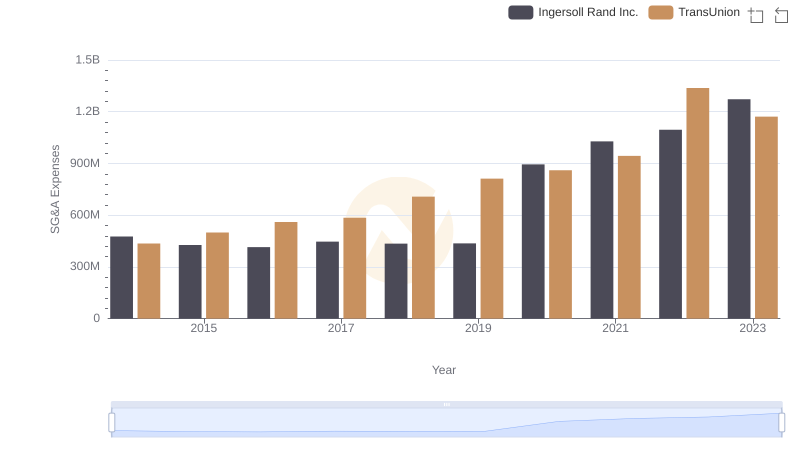
Comparing SG&A Expenses: Ingersoll Rand Inc. vs TransUnion Trends and Insights
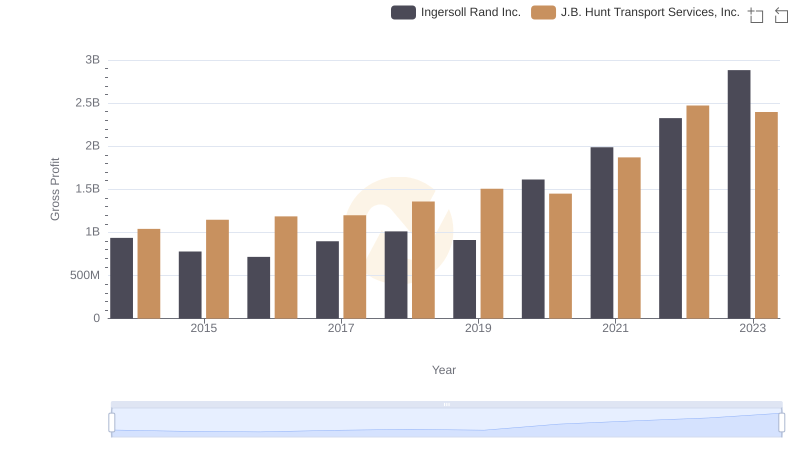
Gross Profit Comparison: Ingersoll Rand Inc. and J.B. Hunt Transport Services, Inc. Trends
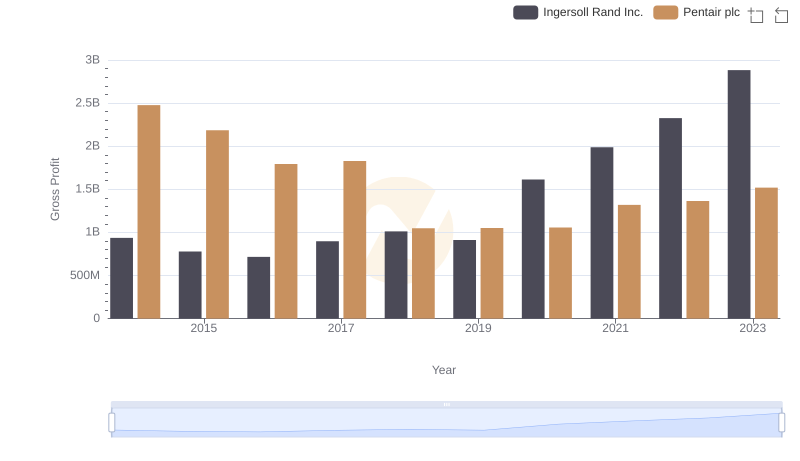
Ingersoll Rand Inc. vs Pentair plc: A Gross Profit Performance Breakdown