| __timestamp | Ingersoll Rand Inc. | J.B. Hunt Transport Services, Inc. |
|---|---|---|
| Wednesday, January 1, 2014 | 936781000 | 1041346000 |
| Thursday, January 1, 2015 | 779100000 | 1146174000 |
| Friday, January 1, 2016 | 716731000 | 1185633000 |
| Sunday, January 1, 2017 | 897900000 | 1199293000 |
| Monday, January 1, 2018 | 1012500000 | 1359217000 |
| Tuesday, January 1, 2019 | 911700000 | 1506255000 |
| Wednesday, January 1, 2020 | 1613400000 | 1449876000 |
| Friday, January 1, 2021 | 1988500000 | 1869819000 |
| Saturday, January 1, 2022 | 2325600000 | 2472527000 |
| Sunday, January 1, 2023 | 2882200000 | 2396388000 |
| Monday, January 1, 2024 | 0 |
Unveiling the hidden dimensions of data
In the ever-evolving landscape of American industry, the financial performance of companies like Ingersoll Rand Inc. and J.B. Hunt Transport Services, Inc. offers a fascinating glimpse into their strategic prowess. Over the past decade, from 2014 to 2023, both companies have demonstrated remarkable growth in gross profit, with Ingersoll Rand Inc. seeing an impressive increase of over 200% and J.B. Hunt Transport Services, Inc. achieving a 130% rise.
This comparison highlights the dynamic nature of these industries and the strategic decisions that drive financial success.
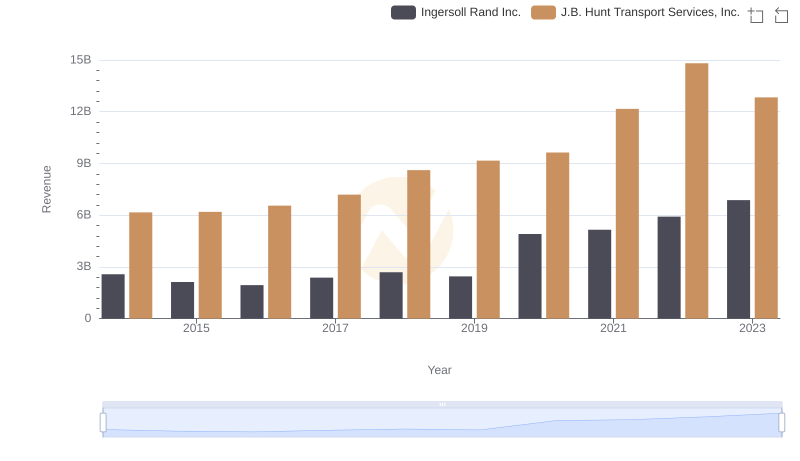
Comparing Revenue Performance: Ingersoll Rand Inc. or J.B. Hunt Transport Services, Inc.?
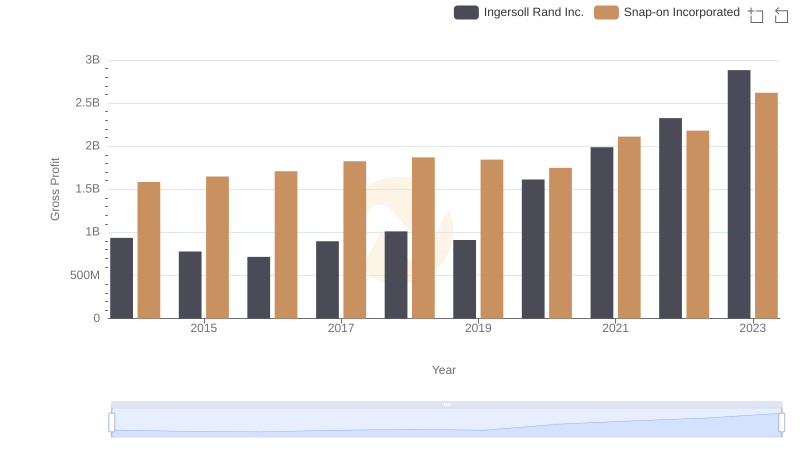
Key Insights on Gross Profit: Ingersoll Rand Inc. vs Snap-on Incorporated
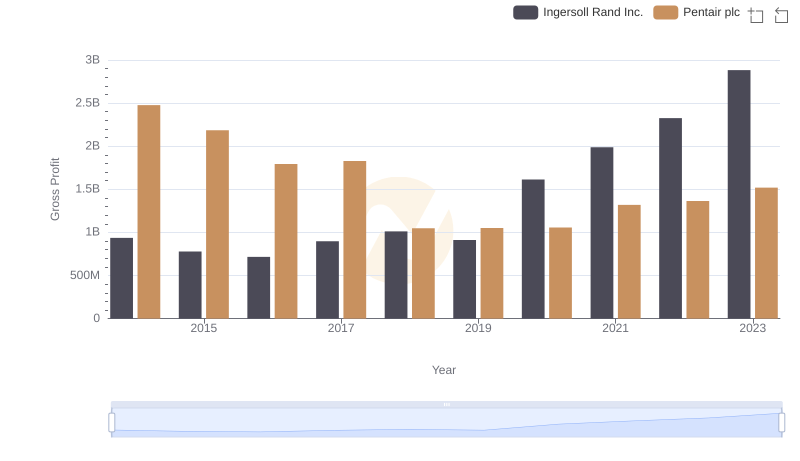
Ingersoll Rand Inc. vs Pentair plc: A Gross Profit Performance Breakdown
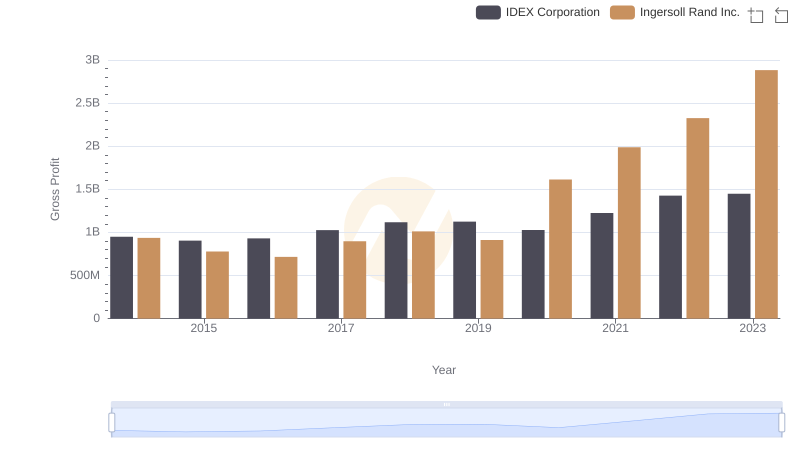
Gross Profit Analysis: Comparing Ingersoll Rand Inc. and IDEX Corporation
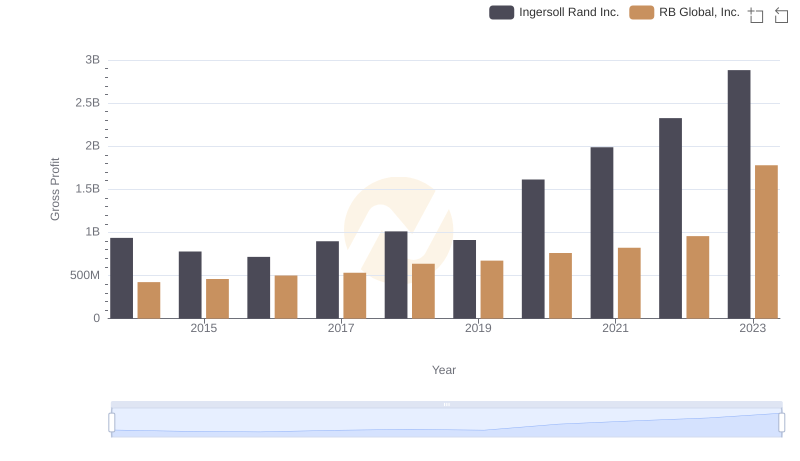
Gross Profit Analysis: Comparing Ingersoll Rand Inc. and RB Global, Inc.
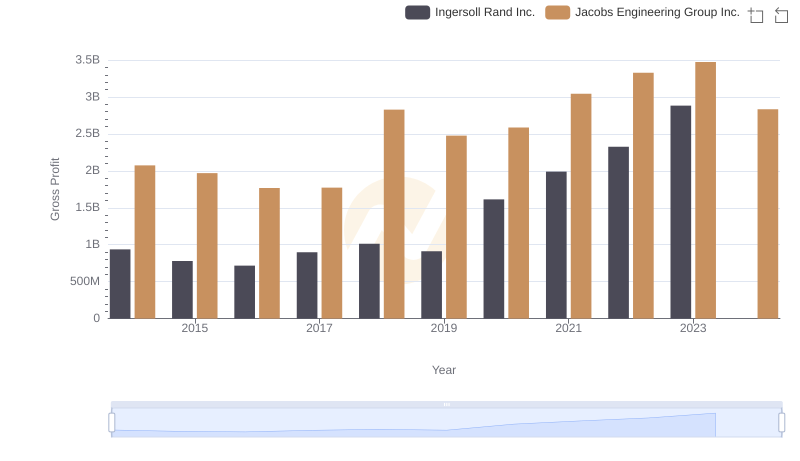
Ingersoll Rand Inc. vs Jacobs Engineering Group Inc.: A Gross Profit Performance Breakdown
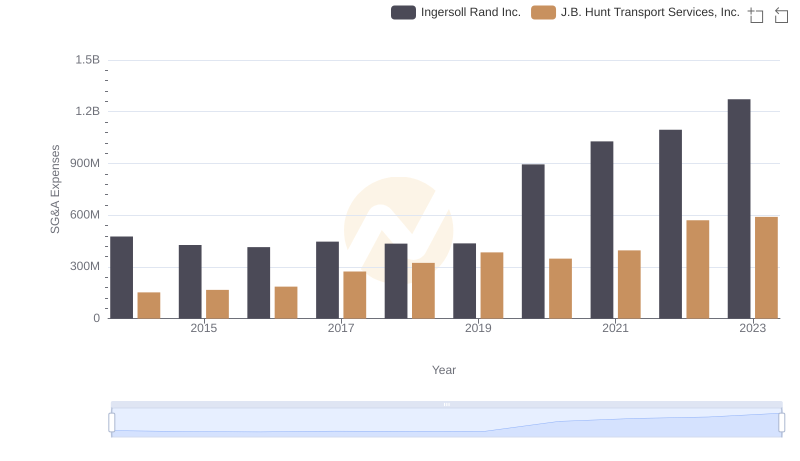
Ingersoll Rand Inc. or J.B. Hunt Transport Services, Inc.: Who Manages SG&A Costs Better?