| __timestamp | Booz Allen Hamilton Holding Corporation | Global Payments Inc. |
|---|---|---|
| Wednesday, January 1, 2014 | 2762580000 | 1751611000 |
| Thursday, January 1, 2015 | 2680921000 | 1750511000 |
| Friday, January 1, 2016 | 2825712000 | 1767444000 |
| Sunday, January 1, 2017 | 3112302000 | 2047126000 |
| Monday, January 1, 2018 | 3304750000 | 2271352000 |
| Tuesday, January 1, 2019 | 3603571000 | 2838089000 |
| Wednesday, January 1, 2020 | 4084661000 | 3772831000 |
| Friday, January 1, 2021 | 4201408000 | 4750037000 |
| Saturday, January 1, 2022 | 4464078000 | 5196898000 |
| Sunday, January 1, 2023 | 4954101000 | 5926898000 |
| Monday, January 1, 2024 | 2459049000 | 6345778000 |
Cracking the code
In the ever-evolving landscape of corporate finance, understanding the trajectory of gross profits is crucial for investors and analysts alike. Over the past decade, Booz Allen Hamilton Holding Corporation and Global Payments Inc. have showcased intriguing trends in their financial performance. From 2014 to 2023, Booz Allen Hamilton's gross profit surged by approximately 79%, peaking in 2023. Meanwhile, Global Payments Inc. experienced a remarkable 238% increase, highlighting its robust growth strategy. Notably, 2020 marked a pivotal year for both companies, with Global Payments surpassing Booz Allen Hamilton in gross profit for the first time. However, data for 2024 is incomplete, leaving room for speculation on future trajectories. This analysis underscores the dynamic nature of the financial sector and the importance of strategic planning in maintaining competitive advantage.
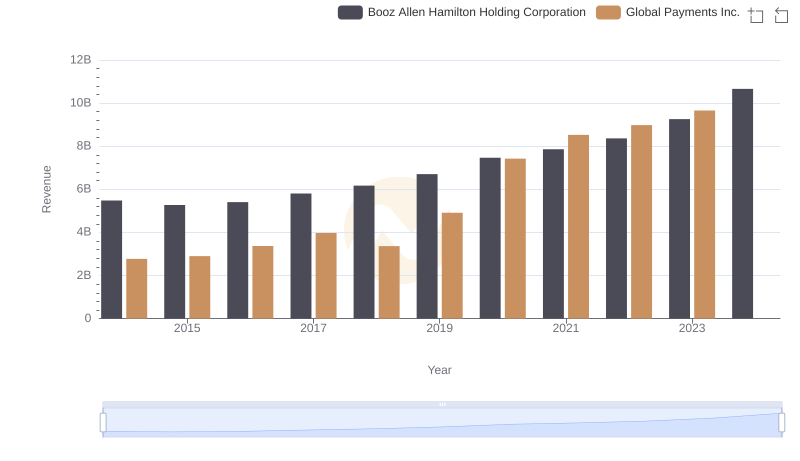
Comparing Revenue Performance: Global Payments Inc. or Booz Allen Hamilton Holding Corporation?
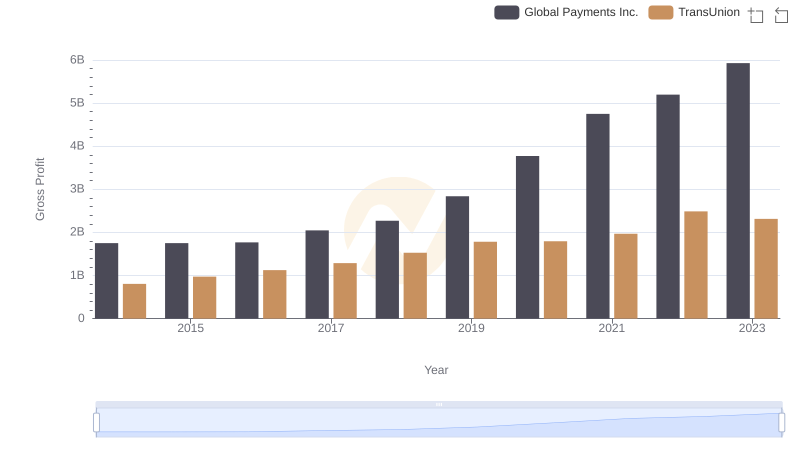
Global Payments Inc. and TransUnion: A Detailed Gross Profit Analysis
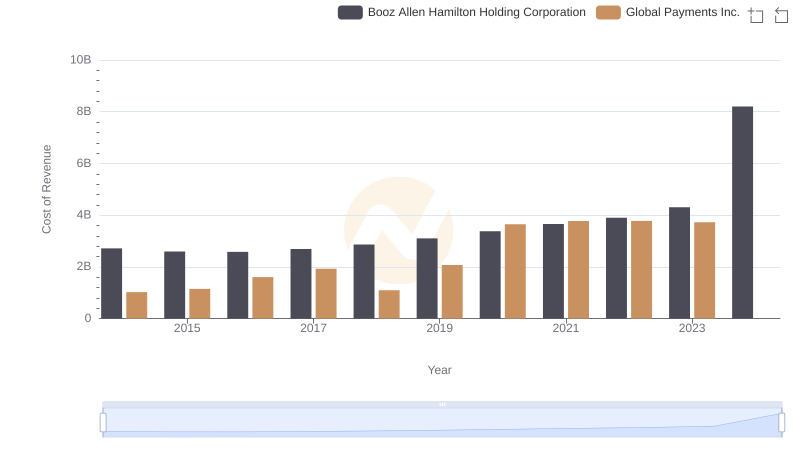
Comparing Cost of Revenue Efficiency: Global Payments Inc. vs Booz Allen Hamilton Holding Corporation
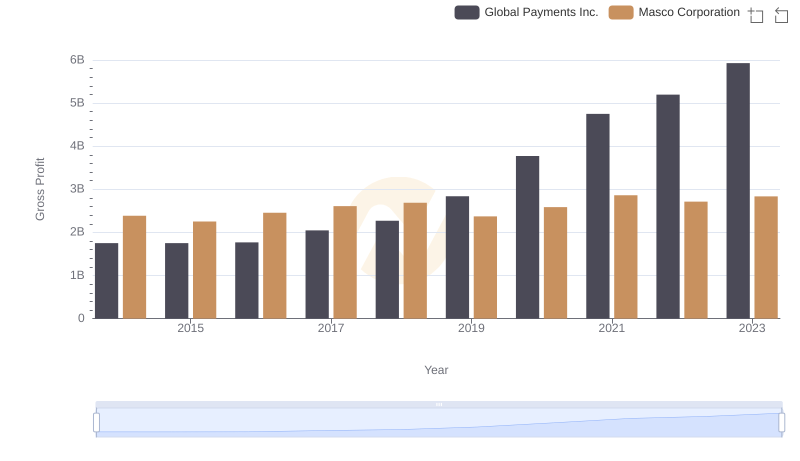
Gross Profit Comparison: Global Payments Inc. and Masco Corporation Trends
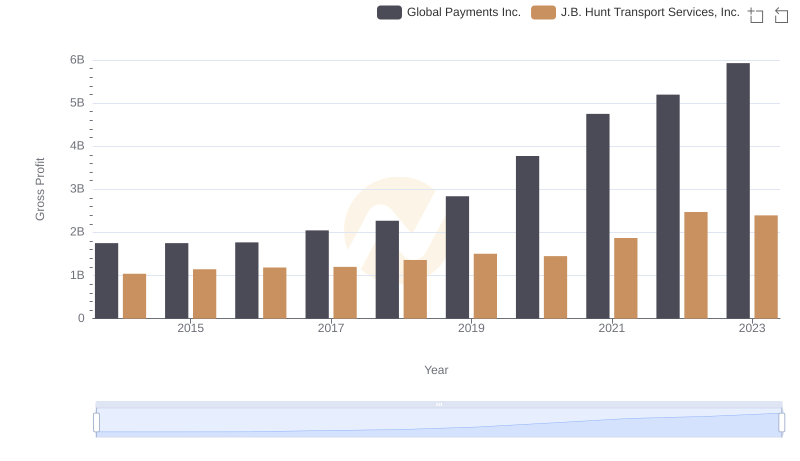
Global Payments Inc. vs J.B. Hunt Transport Services, Inc.: A Gross Profit Performance Breakdown
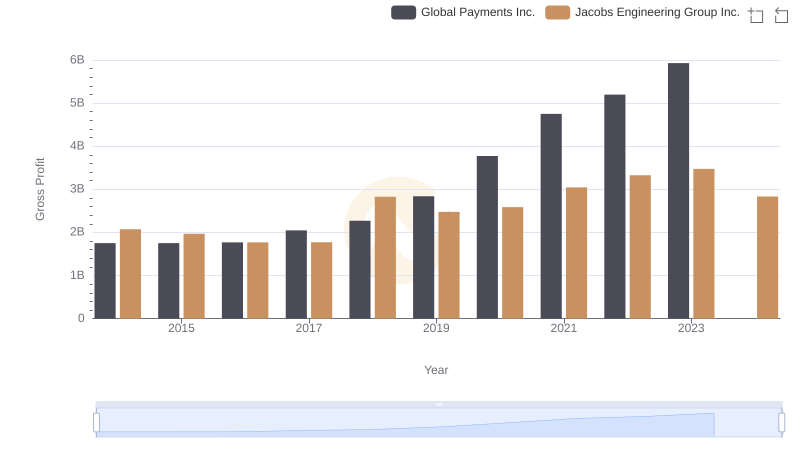
Global Payments Inc. vs Jacobs Engineering Group Inc.: A Gross Profit Performance Breakdown
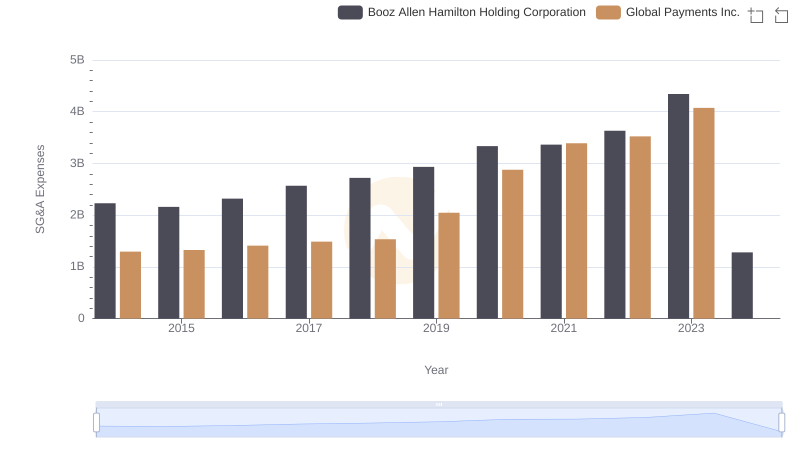
Who Optimizes SG&A Costs Better? Global Payments Inc. or Booz Allen Hamilton Holding Corporation
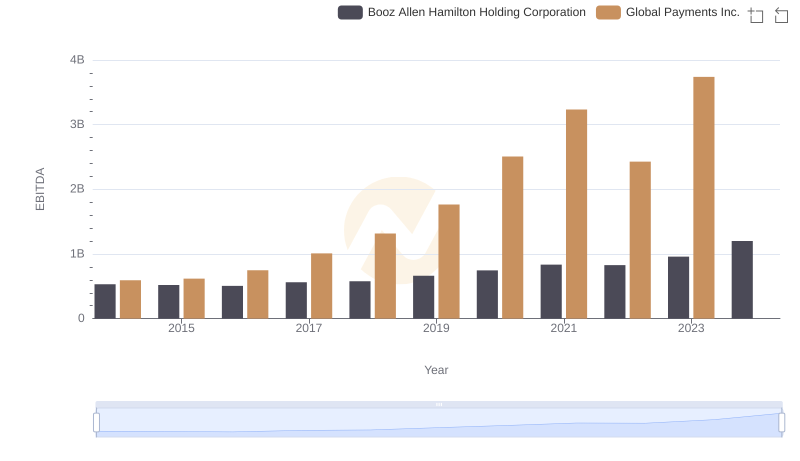
A Side-by-Side Analysis of EBITDA: Global Payments Inc. and Booz Allen Hamilton Holding Corporation