| __timestamp | Carlisle Companies Incorporated | Eaton Corporation plc |
|---|---|---|
| Wednesday, January 1, 2014 | 512300000 | 3586000000 |
| Thursday, January 1, 2015 | 631900000 | 3302000000 |
| Friday, January 1, 2016 | 580200000 | 3176000000 |
| Sunday, January 1, 2017 | 609300000 | 3418000000 |
| Monday, January 1, 2018 | 696100000 | 3875000000 |
| Tuesday, January 1, 2019 | 851000000 | 2827000000 |
| Wednesday, January 1, 2020 | 733100000 | 1674000000 |
| Friday, January 1, 2021 | 816100000 | 2423000000 |
| Saturday, January 1, 2022 | 1483400000 | 3031000000 |
| Sunday, January 1, 2023 | 1210700000 | 4904000000 |
| Monday, January 1, 2024 | 1356800000 | 5547999771 |
Unleashing insights
In the ever-evolving landscape of industrial giants, Eaton Corporation plc and Carlisle Companies Incorporated have showcased intriguing financial trajectories over the past decade. From 2014 to 2023, Eaton's EBITDA consistently outpaced Carlisle's, with Eaton's figures peaking at a staggering 4.9 billion in 2023, marking a 37% increase from its 2014 value. In contrast, Carlisle's EBITDA saw a more modest growth, culminating in a 1.2 billion figure in 2023, a 136% rise from its 2014 baseline.
The data reveals Eaton's resilience, especially during economic downturns, as seen in 2020 when its EBITDA dipped to 1.7 billion, only to recover robustly in subsequent years. Meanwhile, Carlisle's steady climb reflects strategic expansions and market adaptations. This comparative analysis underscores the dynamic strategies employed by these corporations, offering valuable insights into their financial health and market positioning.
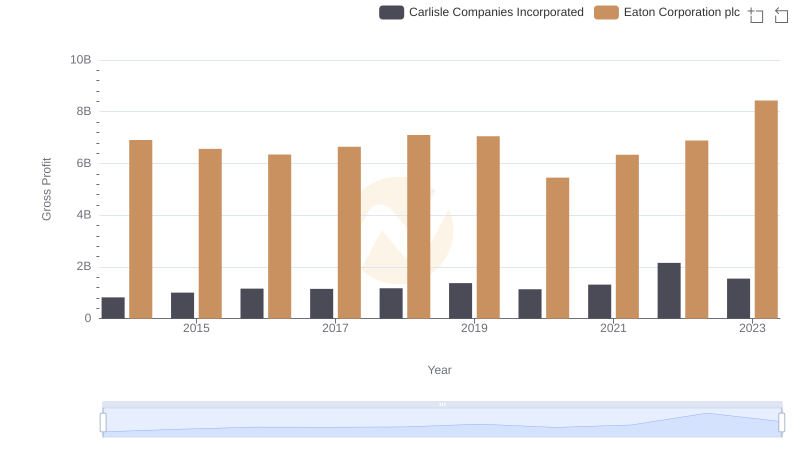
Gross Profit Comparison: Eaton Corporation plc and Carlisle Companies Incorporated Trends
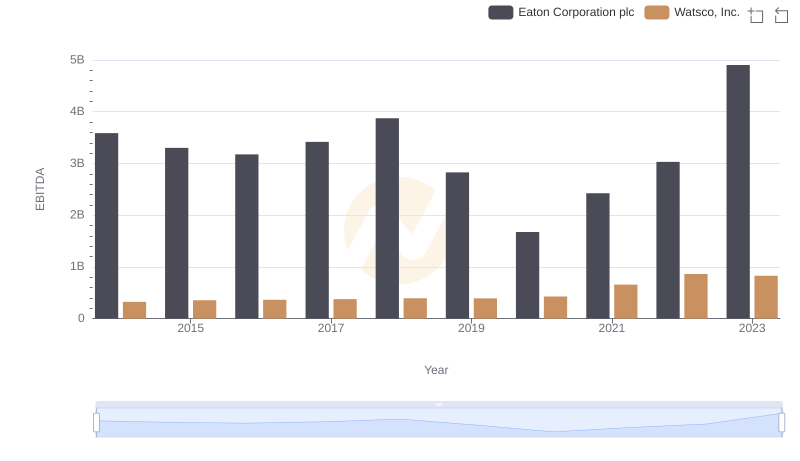
Professional EBITDA Benchmarking: Eaton Corporation plc vs Watsco, Inc.
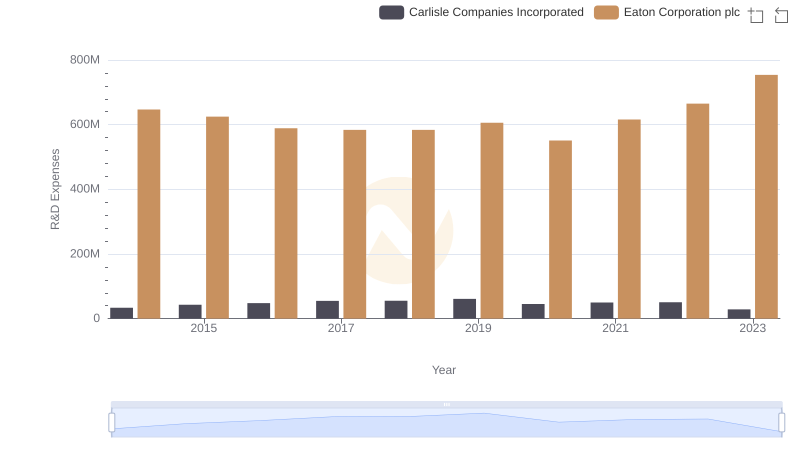
R&D Insights: How Eaton Corporation plc and Carlisle Companies Incorporated Allocate Funds
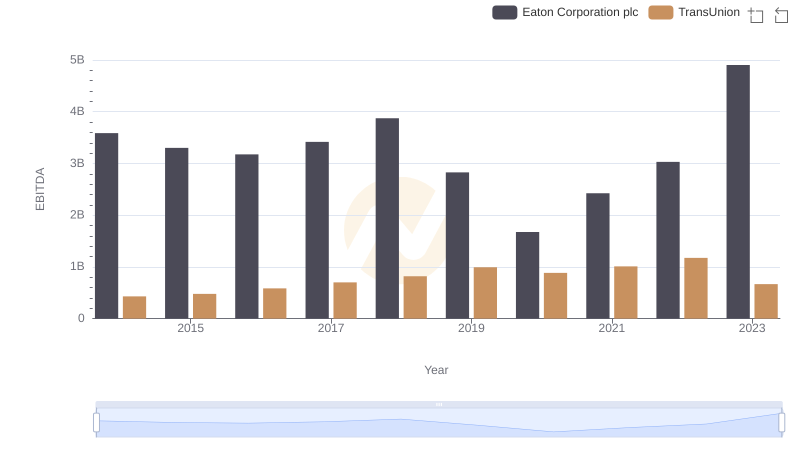
Eaton Corporation plc vs TransUnion: In-Depth EBITDA Performance Comparison
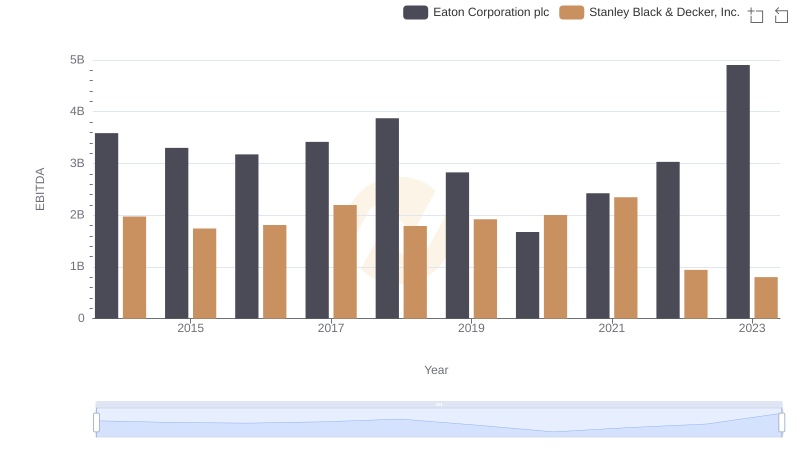
Professional EBITDA Benchmarking: Eaton Corporation plc vs Stanley Black & Decker, Inc.
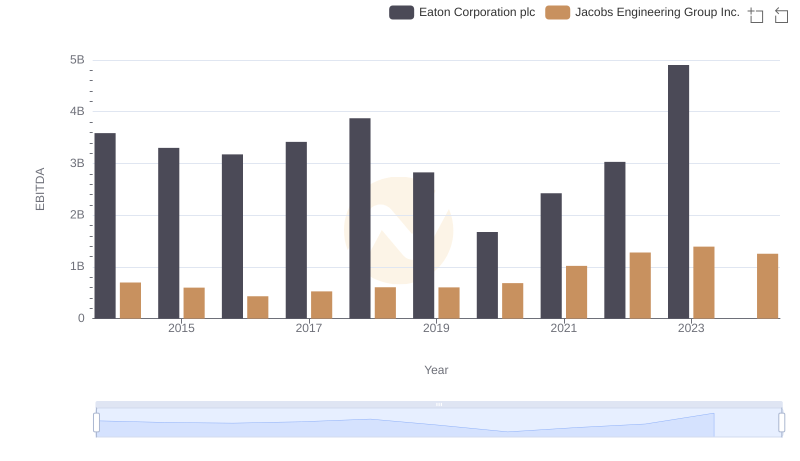
EBITDA Metrics Evaluated: Eaton Corporation plc vs Jacobs Engineering Group Inc.