| __timestamp | Automatic Data Processing, Inc. | Builders FirstSource, Inc. |
|---|---|---|
| Wednesday, January 1, 2014 | 11832800000 | 1604096000 |
| Thursday, January 1, 2015 | 10560800000 | 3564425000 |
| Friday, January 1, 2016 | 11290500000 | 6367284000 |
| Sunday, January 1, 2017 | 11982400000 | 7034209000 |
| Monday, January 1, 2018 | 12859300000 | 7724771000 |
| Tuesday, January 1, 2019 | 13613300000 | 7280431000 |
| Wednesday, January 1, 2020 | 14589800000 | 8558874000 |
| Friday, January 1, 2021 | 15005400000 | 19893856000 |
| Saturday, January 1, 2022 | 16498300000 | 22726418000 |
| Sunday, January 1, 2023 | 18012200000 | 17097330000 |
| Monday, January 1, 2024 | 19202600000 |
Data in motion
In the ever-evolving landscape of corporate America, revenue generation is a key indicator of a company's market prowess. Over the past decade, Automatic Data Processing, Inc. (ADP) and Builders FirstSource, Inc. have been at the forefront of this financial race. From 2014 to 2023, ADP consistently demonstrated robust growth, with revenue increasing by approximately 62%, peaking at $19.2 billion in 2023. Meanwhile, Builders FirstSource, Inc. showcased a remarkable surge, especially between 2020 and 2022, where their revenue nearly tripled, reaching a high of $22.7 billion in 2022. However, 2023 saw a slight dip for Builders FirstSource, with revenue falling to $17.1 billion. This dynamic shift highlights the competitive nature of these industries and the resilience required to maintain market leadership. As we look to the future, the question remains: who will continue to dominate the revenue charts?

Comparing Revenue Performance: Automatic Data Processing, Inc. or Lennox International Inc.?
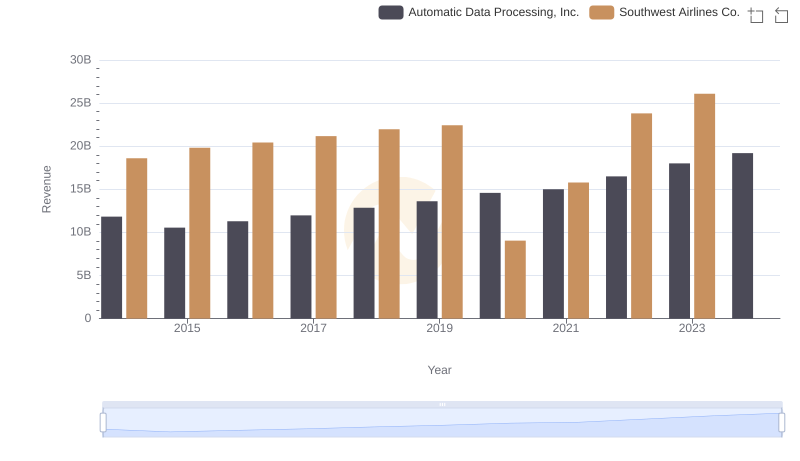
Automatic Data Processing, Inc. vs Southwest Airlines Co.: Examining Key Revenue Metrics
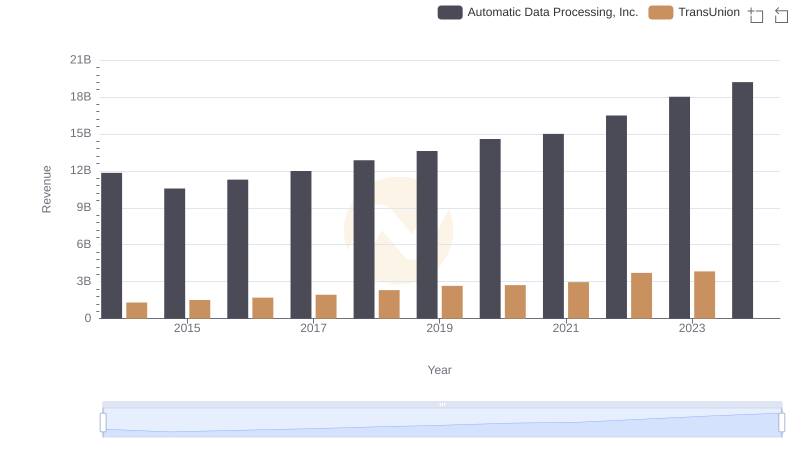
Comparing Revenue Performance: Automatic Data Processing, Inc. or TransUnion?

Revenue Showdown: Automatic Data Processing, Inc. vs AerCap Holdings N.V.
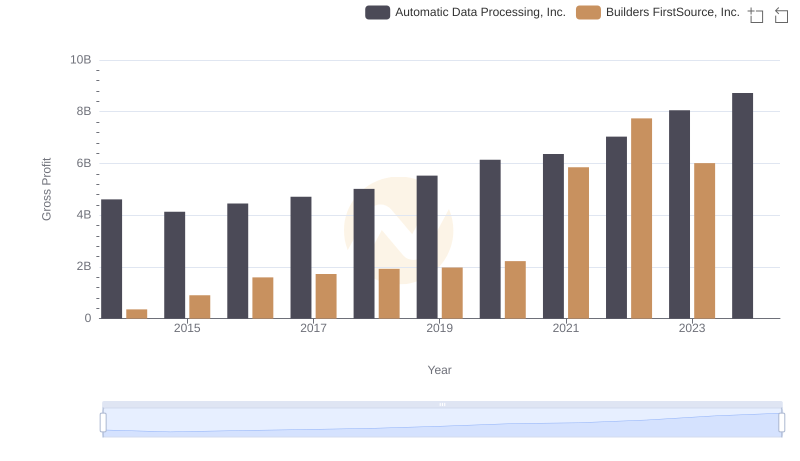
Gross Profit Comparison: Automatic Data Processing, Inc. and Builders FirstSource, Inc. Trends