| __timestamp | International Business Machines Corporation | Western Digital Corporation |
|---|---|---|
| Wednesday, January 1, 2014 | 46407000000 | 4360000000 |
| Thursday, January 1, 2015 | 40684000000 | 4221000000 |
| Friday, January 1, 2016 | 38516000000 | 3435000000 |
| Sunday, January 1, 2017 | 36943000000 | 6072000000 |
| Monday, January 1, 2018 | 36936000000 | 7705000000 |
| Tuesday, January 1, 2019 | 31533000000 | 3752000000 |
| Wednesday, January 1, 2020 | 30865000000 | 3781000000 |
| Friday, January 1, 2021 | 31486000000 | 4521000000 |
| Saturday, January 1, 2022 | 32687000000 | 5874000000 |
| Sunday, January 1, 2023 | 34300000000 | 1887000000 |
| Monday, January 1, 2024 | 35551000000 | 2945000000 |
Cracking the code
In the ever-evolving landscape of technology, the financial performance of industry giants like International Business Machines Corporation (IBM) and Western Digital Corporation (WDC) offers a fascinating glimpse into their strategic maneuvers. Over the past decade, IBM's gross profit has seen a decline of approximately 24%, from its peak in 2014 to 2024. This trend reflects IBM's transition from hardware to a more service-oriented business model. Meanwhile, Western Digital's gross profit has experienced fluctuations, with a notable peak in 2018, followed by a significant drop by 2023, indicating the volatile nature of the storage solutions market.
Despite these challenges, both companies continue to adapt and innovate. IBM's focus on cloud computing and AI, and Western Digital's advancements in data storage technology, underscore their resilience in a competitive market. As we look to the future, these trends highlight the importance of strategic adaptation in sustaining financial growth.
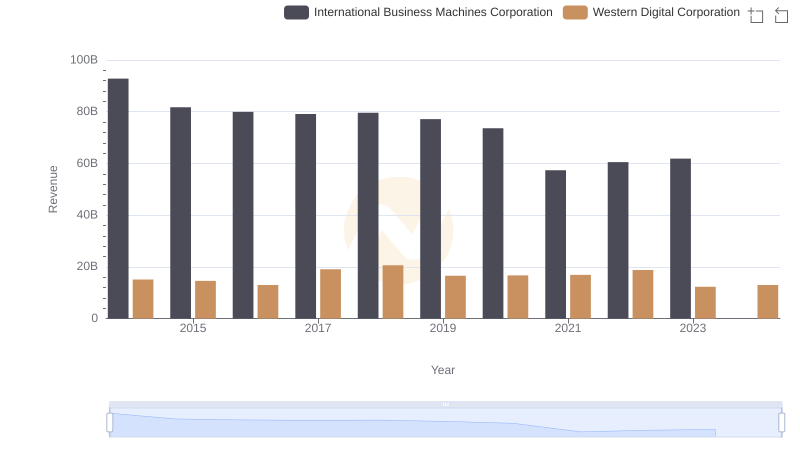
International Business Machines Corporation and Western Digital Corporation: A Comprehensive Revenue Analysis
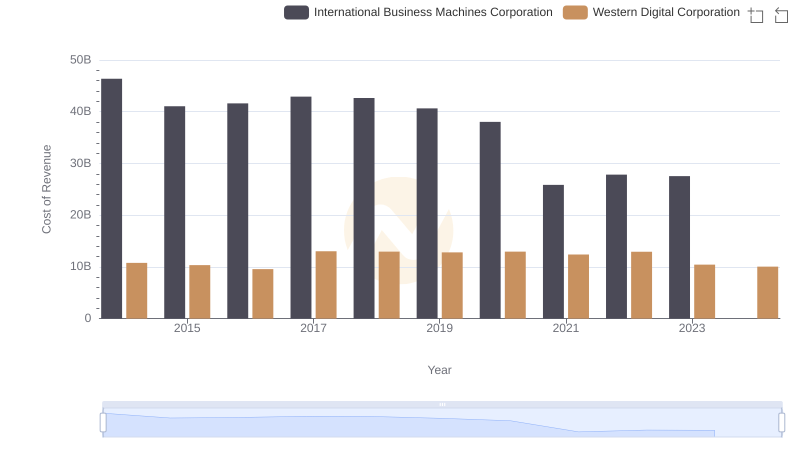
Cost of Revenue: Key Insights for International Business Machines Corporation and Western Digital Corporation

Gross Profit Trends Compared: International Business Machines Corporation vs NetApp, Inc.
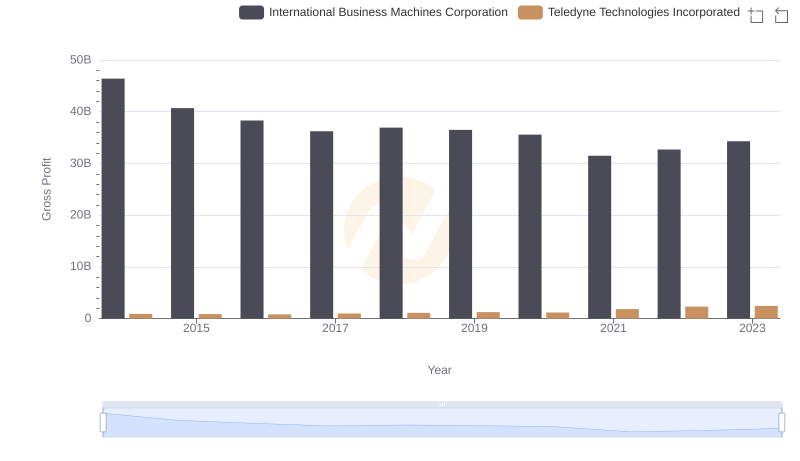
International Business Machines Corporation and Teledyne Technologies Incorporated: A Detailed Gross Profit Analysis
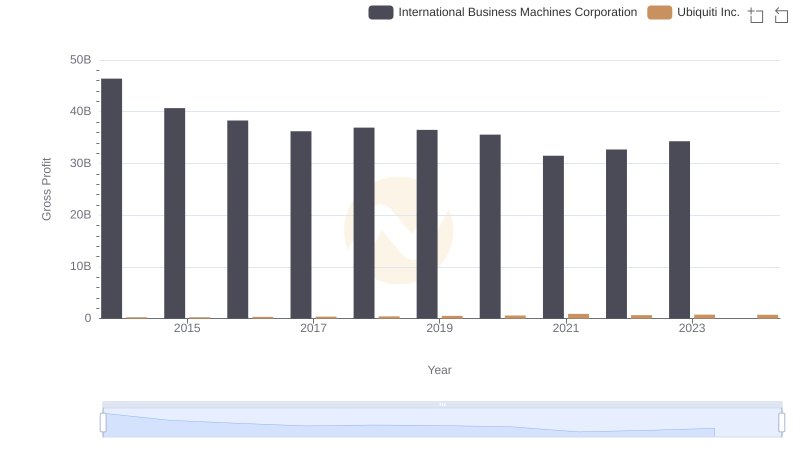
Who Generates Higher Gross Profit? International Business Machines Corporation or Ubiquiti Inc.
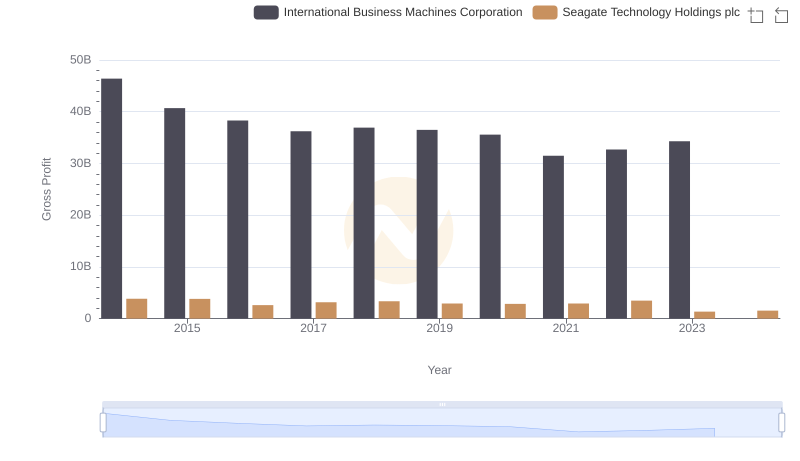
International Business Machines Corporation vs Seagate Technology Holdings plc: A Gross Profit Performance Breakdown
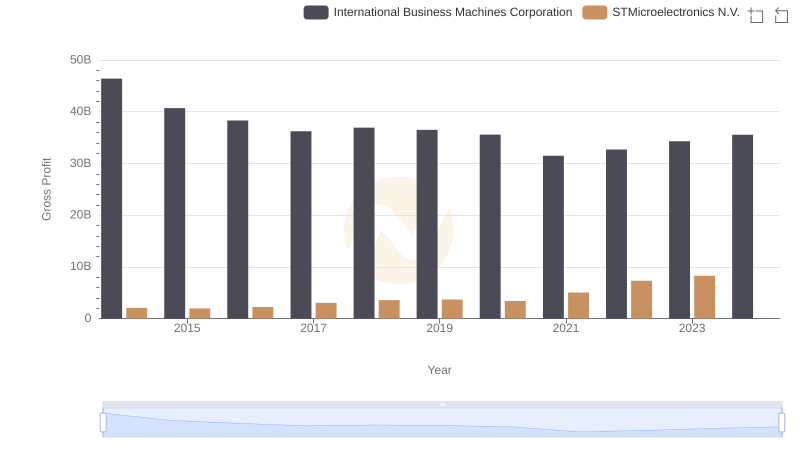
Who Generates Higher Gross Profit? International Business Machines Corporation or STMicroelectronics N.V.
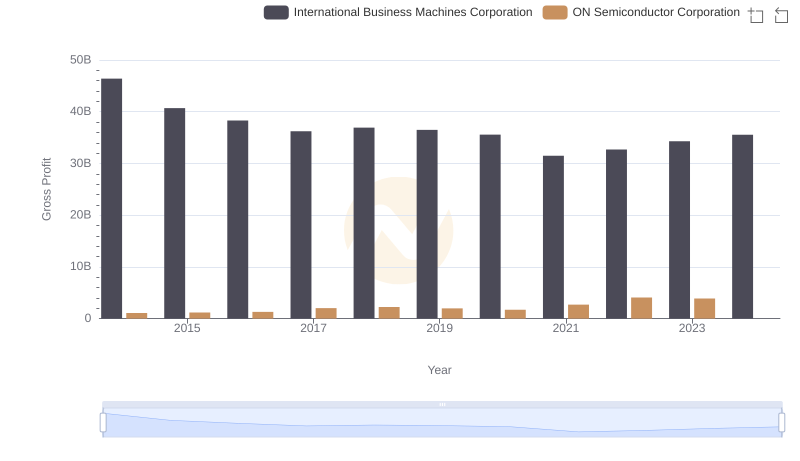
International Business Machines Corporation vs ON Semiconductor Corporation: A Gross Profit Performance Breakdown
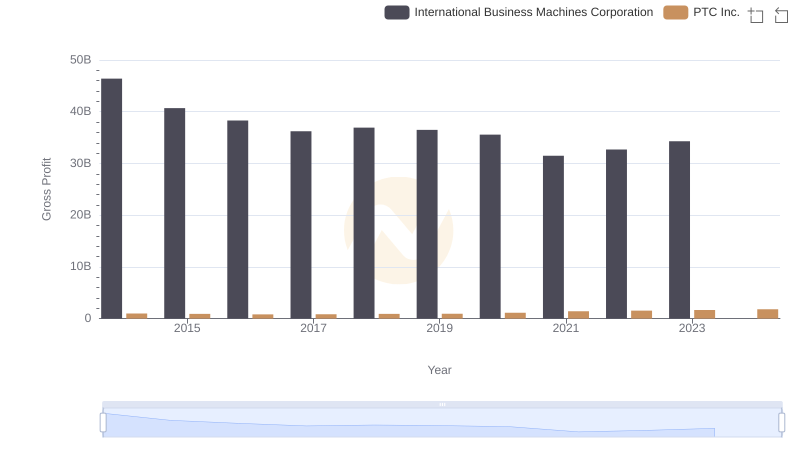
Gross Profit Analysis: Comparing International Business Machines Corporation and PTC Inc.
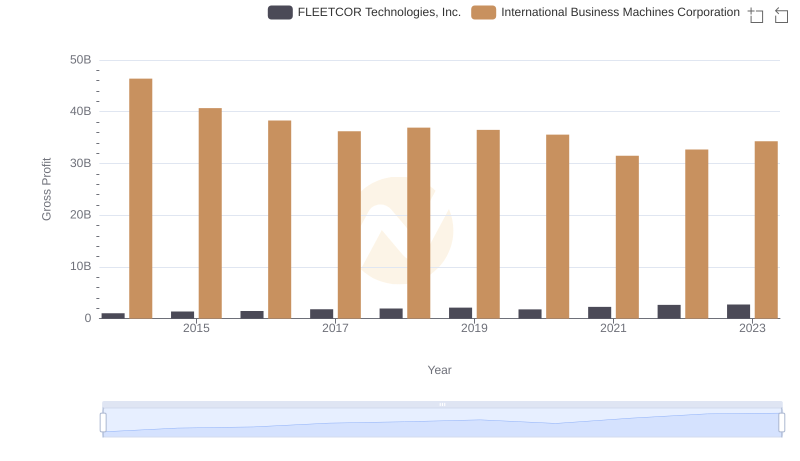
Gross Profit Comparison: International Business Machines Corporation and FLEETCOR Technologies, Inc. Trends
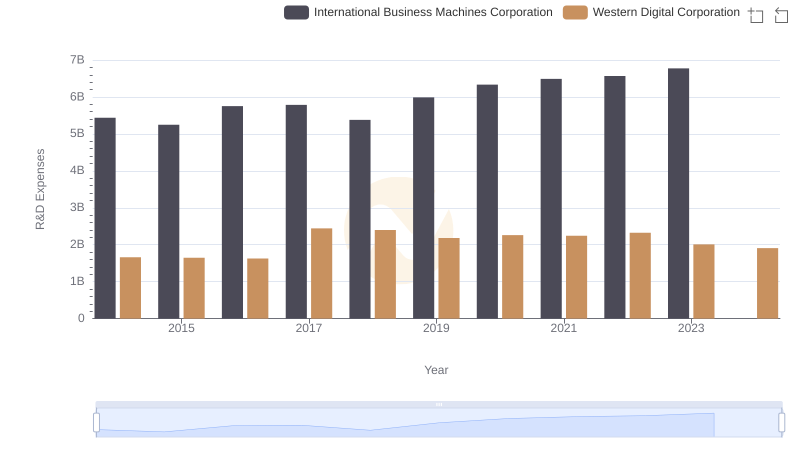
Research and Development Expenses Breakdown: International Business Machines Corporation vs Western Digital Corporation
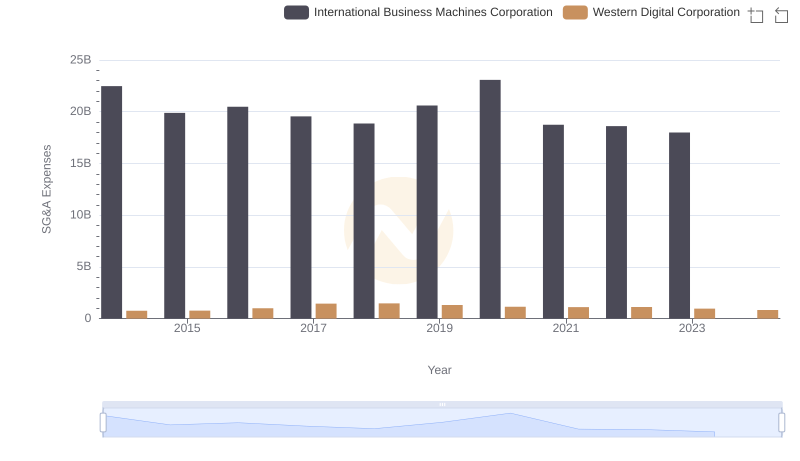
Selling, General, and Administrative Costs: International Business Machines Corporation vs Western Digital Corporation