| __timestamp | Cintas Corporation | J.B. Hunt Transport Services, Inc. |
|---|---|---|
| Wednesday, January 1, 2014 | 1914386000 | 1041346000 |
| Thursday, January 1, 2015 | 1921337000 | 1146174000 |
| Friday, January 1, 2016 | 2129870000 | 1185633000 |
| Sunday, January 1, 2017 | 2380295000 | 1199293000 |
| Monday, January 1, 2018 | 2908523000 | 1359217000 |
| Tuesday, January 1, 2019 | 3128588000 | 1506255000 |
| Wednesday, January 1, 2020 | 3233748000 | 1449876000 |
| Friday, January 1, 2021 | 3314651000 | 1869819000 |
| Saturday, January 1, 2022 | 3632246000 | 2472527000 |
| Sunday, January 1, 2023 | 4173368000 | 2396388000 |
| Monday, January 1, 2024 | 4686416000 |
Infusing magic into the data realm
In the competitive landscape of American business, Cintas Corporation and J.B. Hunt Transport Services, Inc. have carved out significant niches. Over the past decade, Cintas has seen its gross profit soar by over 145%, from approximately $1.9 billion in 2014 to an impressive $4.7 billion in 2024. This growth reflects Cintas's strategic expansion and operational efficiency in the uniform and facility services industry.
Meanwhile, J.B. Hunt, a leader in transportation and logistics, experienced a robust 130% increase in gross profit, peaking at around $2.5 billion in 2022. However, data for 2024 is missing, leaving room for speculation about their current performance.
This analysis highlights the resilience and adaptability of these companies in their respective sectors, offering valuable insights into their financial trajectories and market strategies.
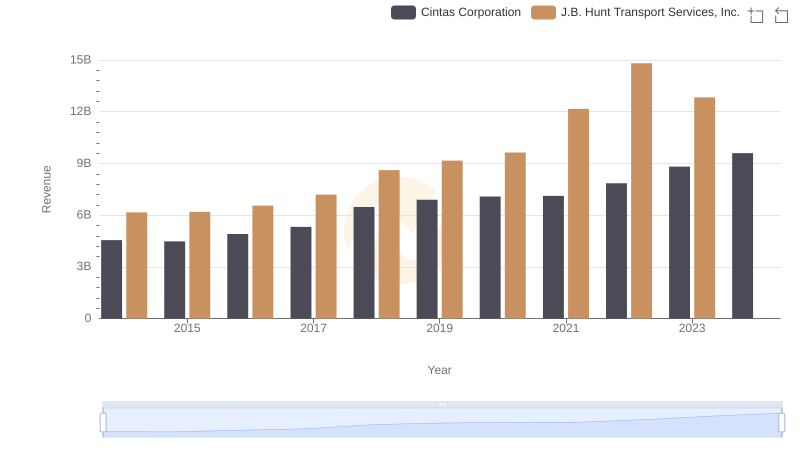
Cintas Corporation and J.B. Hunt Transport Services, Inc.: A Comprehensive Revenue Analysis
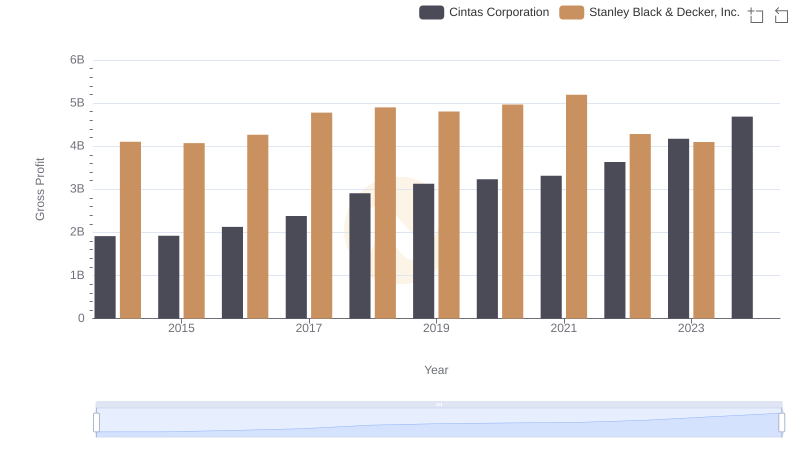
Key Insights on Gross Profit: Cintas Corporation vs Stanley Black & Decker, Inc.
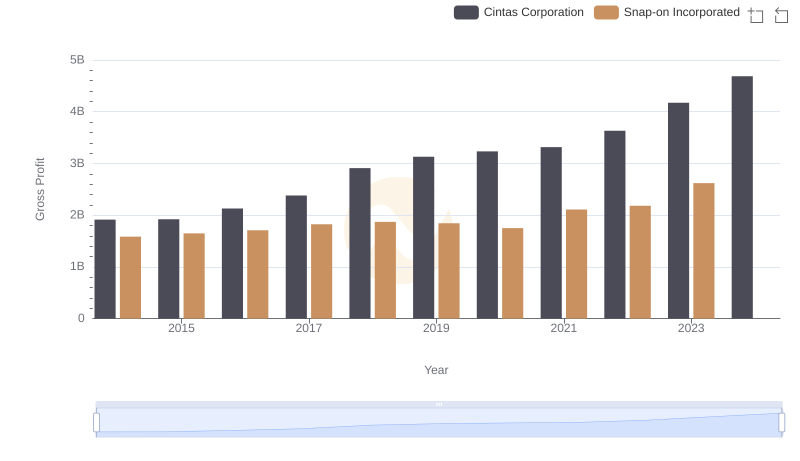
Gross Profit Trends Compared: Cintas Corporation vs Snap-on Incorporated
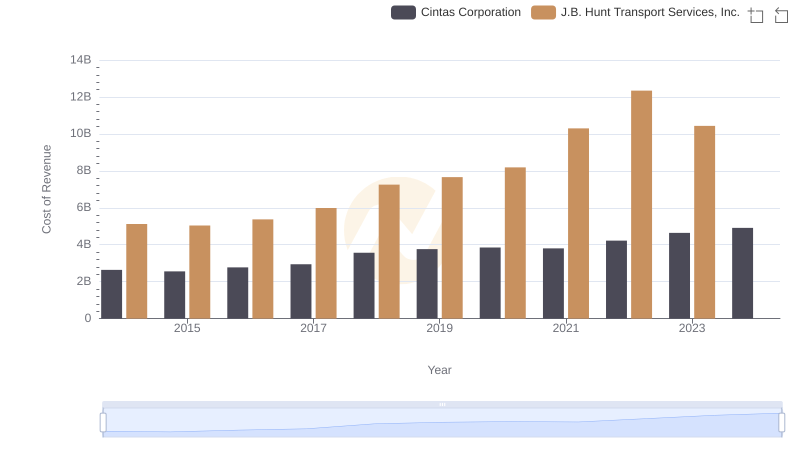
Cintas Corporation vs J.B. Hunt Transport Services, Inc.: Efficiency in Cost of Revenue Explored
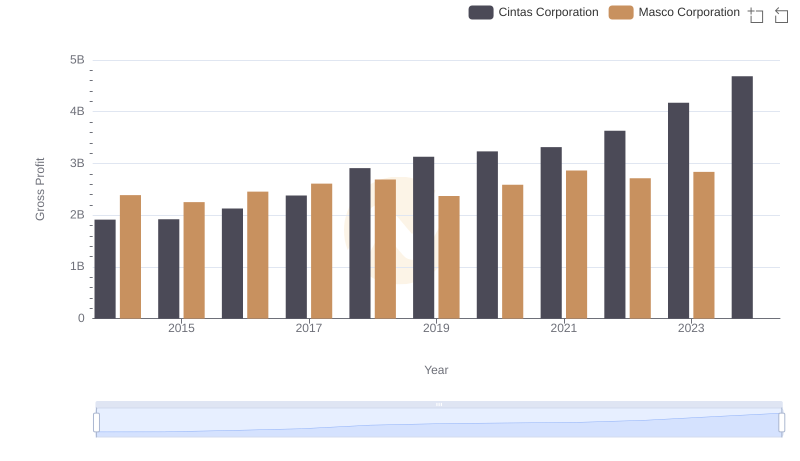
Gross Profit Analysis: Comparing Cintas Corporation and Masco Corporation
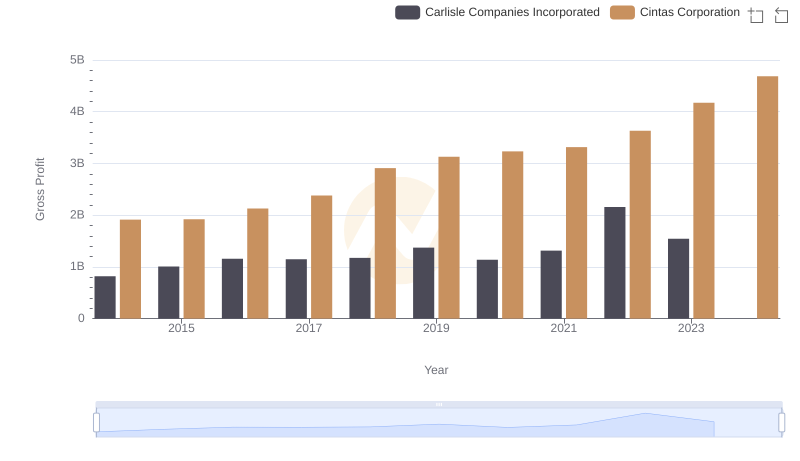
Gross Profit Comparison: Cintas Corporation and Carlisle Companies Incorporated Trends
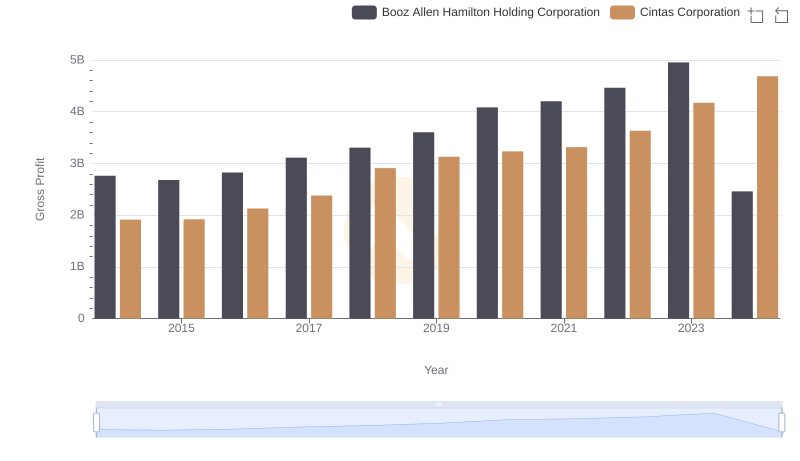
Cintas Corporation and Booz Allen Hamilton Holding Corporation: A Detailed Gross Profit Analysis
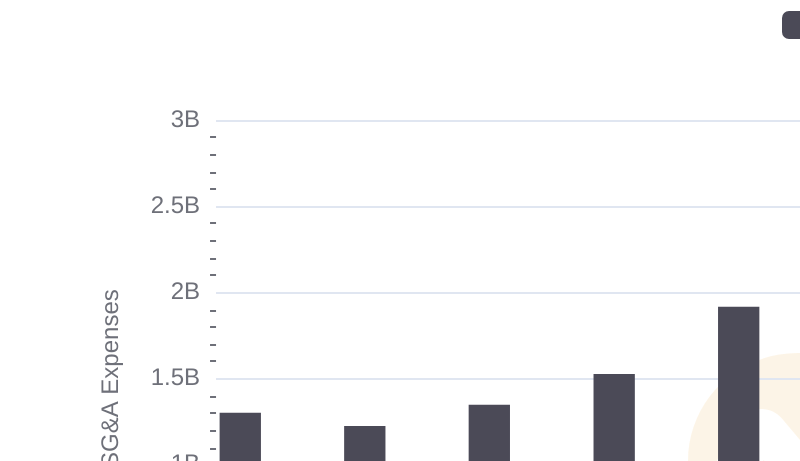
Comparing SG&A Expenses: Cintas Corporation vs J.B. Hunt Transport Services, Inc. Trends and Insights
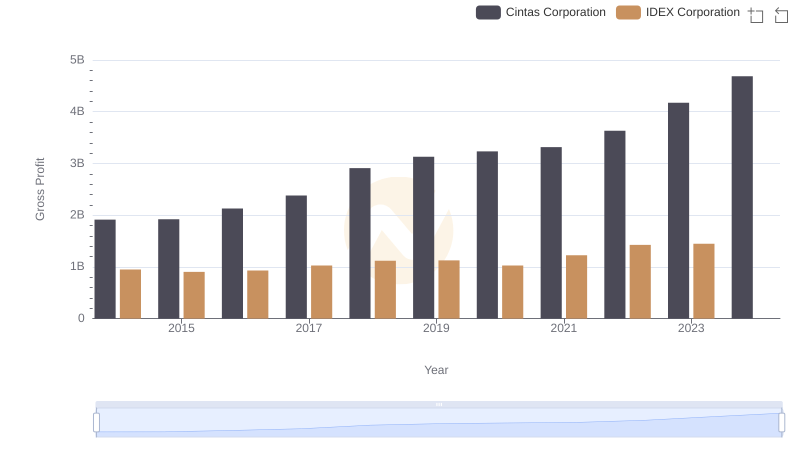
Gross Profit Trends Compared: Cintas Corporation vs IDEX Corporation
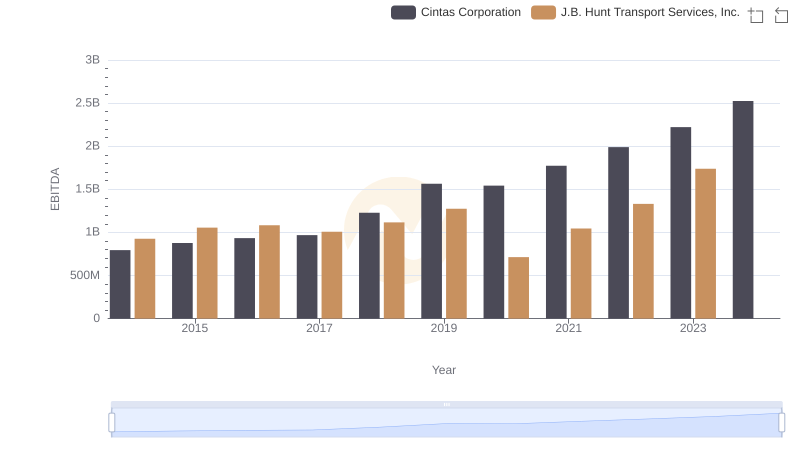
Comparative EBITDA Analysis: Cintas Corporation vs J.B. Hunt Transport Services, Inc.