| __timestamp | Automatic Data Processing, Inc. | Verisk Analytics, Inc. |
|---|---|---|
| Wednesday, January 1, 2014 | 4611400000 | 1030128000 |
| Thursday, January 1, 2015 | 4133200000 | 1264736000 |
| Friday, January 1, 2016 | 4450200000 | 1280800000 |
| Sunday, January 1, 2017 | 4712600000 | 1361400000 |
| Monday, January 1, 2018 | 5016700000 | 1508900000 |
| Tuesday, January 1, 2019 | 5526700000 | 1630300000 |
| Wednesday, January 1, 2020 | 6144700000 | 1790700000 |
| Friday, January 1, 2021 | 6365100000 | 1940800000 |
| Saturday, January 1, 2022 | 7036400000 | 1672400000 |
| Sunday, January 1, 2023 | 8058800000 | 1804900000 |
| Monday, January 1, 2024 | 8725900000 |
Unleashing insights
In the ever-evolving landscape of financial analytics, understanding the gross profit trends of industry giants like Automatic Data Processing, Inc. (ADP) and Verisk Analytics, Inc. offers invaluable insights. Over the past decade, ADP has demonstrated a robust growth trajectory, with its gross profit surging by approximately 89% from 2014 to 2023. This growth reflects ADP's strategic market positioning and operational efficiency. In contrast, Verisk Analytics, Inc. has shown a steady, albeit slower, increase of around 75% over the same period, highlighting its consistent performance in the analytics sector. Notably, the data for 2024 is incomplete, indicating potential future updates. These trends underscore the dynamic nature of the financial services industry, where adaptability and innovation are key to sustained success. As we look to the future, these companies' ability to navigate economic shifts will be crucial in maintaining their competitive edge.

Automatic Data Processing, Inc. vs Verisk Analytics, Inc.: Examining Key Revenue Metrics
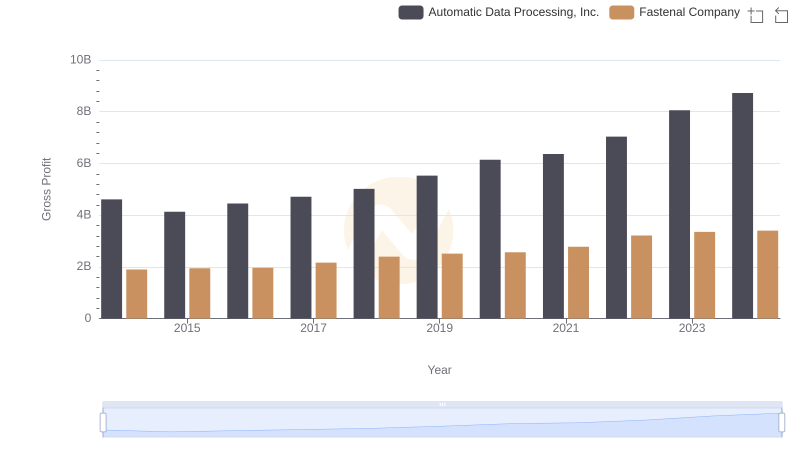
Gross Profit Trends Compared: Automatic Data Processing, Inc. vs Fastenal Company
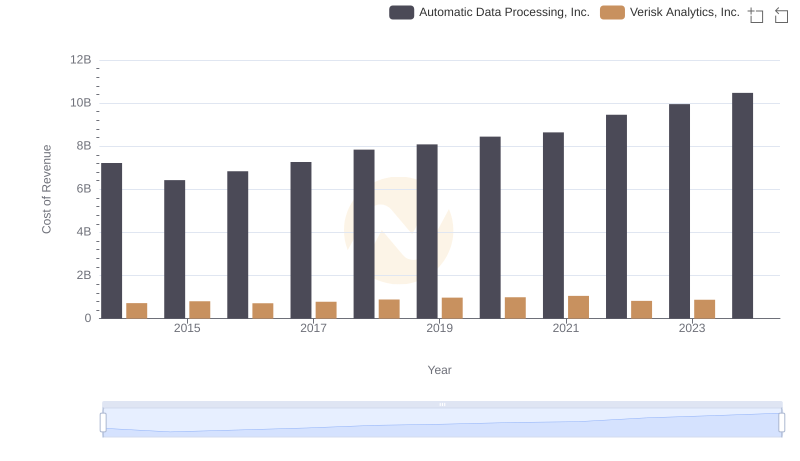
Cost of Revenue Trends: Automatic Data Processing, Inc. vs Verisk Analytics, Inc.
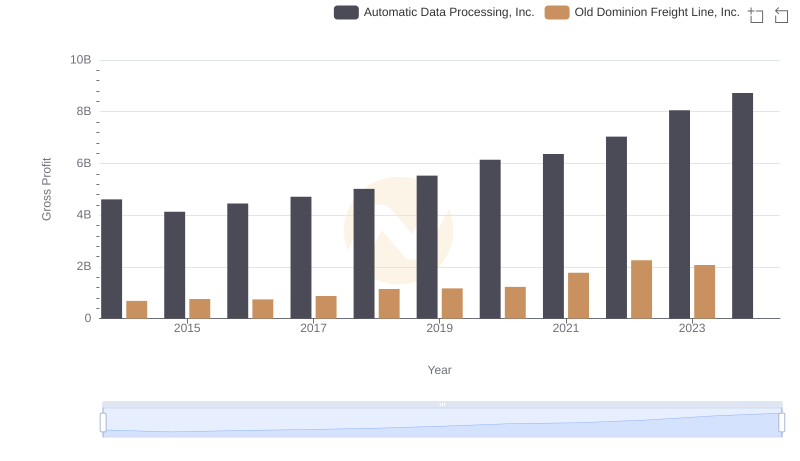
Who Generates Higher Gross Profit? Automatic Data Processing, Inc. or Old Dominion Freight Line, Inc.
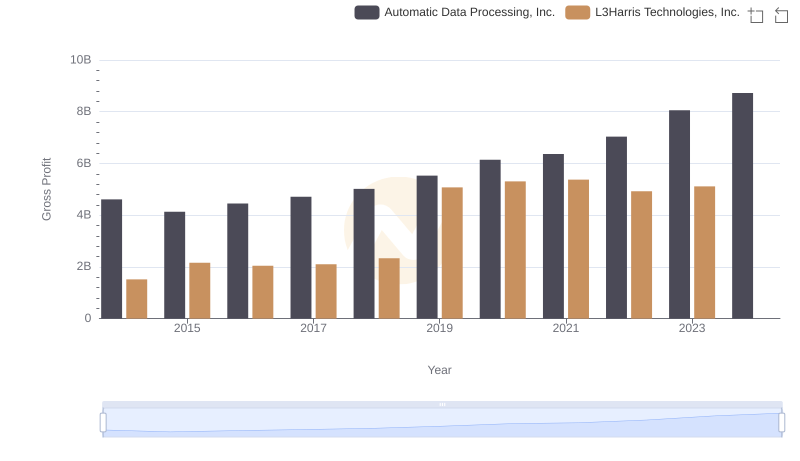
Automatic Data Processing, Inc. and L3Harris Technologies, Inc.: A Detailed Gross Profit Analysis

Who Generates Higher Gross Profit? Automatic Data Processing, Inc. or Ingersoll Rand Inc.

Who Optimizes SG&A Costs Better? Automatic Data Processing, Inc. or Verisk Analytics, Inc.
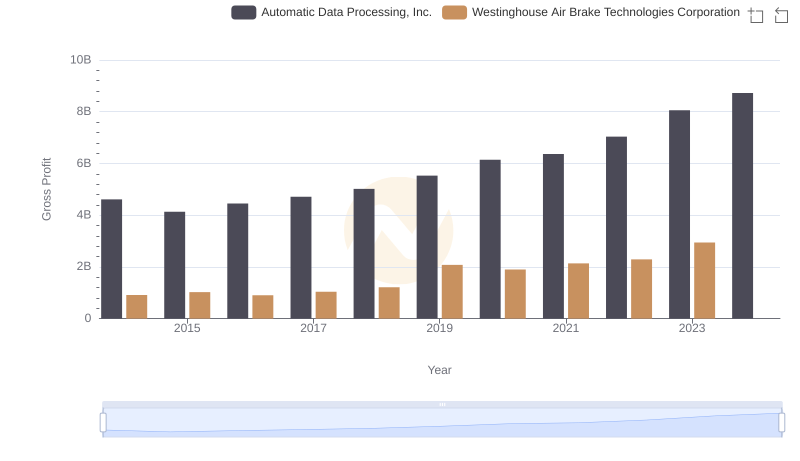
Gross Profit Comparison: Automatic Data Processing, Inc. and Westinghouse Air Brake Technologies Corporation Trends
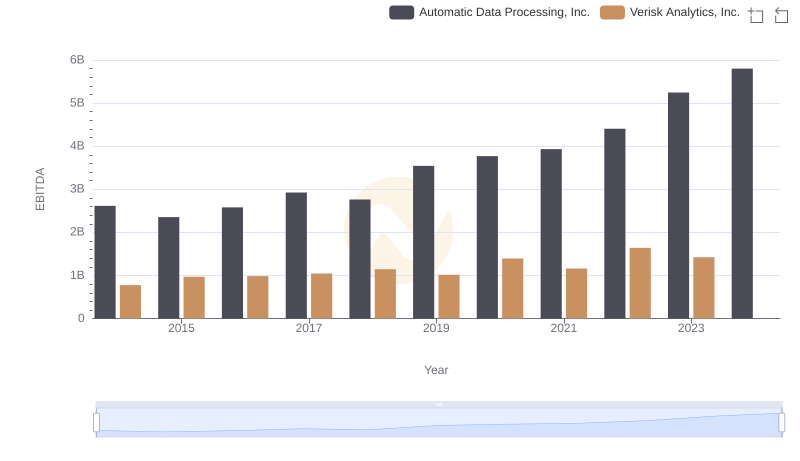
EBITDA Metrics Evaluated: Automatic Data Processing, Inc. vs Verisk Analytics, Inc.