| __timestamp | Automatic Data Processing, Inc. | Verisk Analytics, Inc. |
|---|---|---|
| Wednesday, January 1, 2014 | 2616900000 | 776000000 |
| Thursday, January 1, 2015 | 2355100000 | 972500000 |
| Friday, January 1, 2016 | 2579500000 | 985300000 |
| Sunday, January 1, 2017 | 2927200000 | 1047800000 |
| Monday, January 1, 2018 | 2762900000 | 1145500000 |
| Tuesday, January 1, 2019 | 3544500000 | 1018900000 |
| Wednesday, January 1, 2020 | 3769700000 | 1393800000 |
| Friday, January 1, 2021 | 3931600000 | 1163700000 |
| Saturday, January 1, 2022 | 4405500000 | 1639800000 |
| Sunday, January 1, 2023 | 5244600000 | 1424100000 |
| Monday, January 1, 2024 | 5800000000 |
Cracking the code
In the ever-evolving landscape of financial services, Automatic Data Processing, Inc. (ADP) and Verisk Analytics, Inc. have showcased remarkable EBITDA growth over the past decade. From 2014 to 2023, ADP's EBITDA surged by approximately 122%, reflecting its robust business model and strategic initiatives. In contrast, Verisk Analytics experienced a steady increase of around 83% during the same period, highlighting its resilience in the analytics sector.
ADP's EBITDA growth trajectory was particularly impressive post-2019, with a notable 48% increase from 2019 to 2023. Meanwhile, Verisk Analytics saw its highest growth between 2020 and 2022, with a 17% rise. However, data for 2024 remains incomplete, leaving room for speculation on future trends.
This analysis underscores the dynamic nature of these industry leaders, offering valuable insights for investors and stakeholders alike.

Automatic Data Processing, Inc. vs Verisk Analytics, Inc.: Examining Key Revenue Metrics
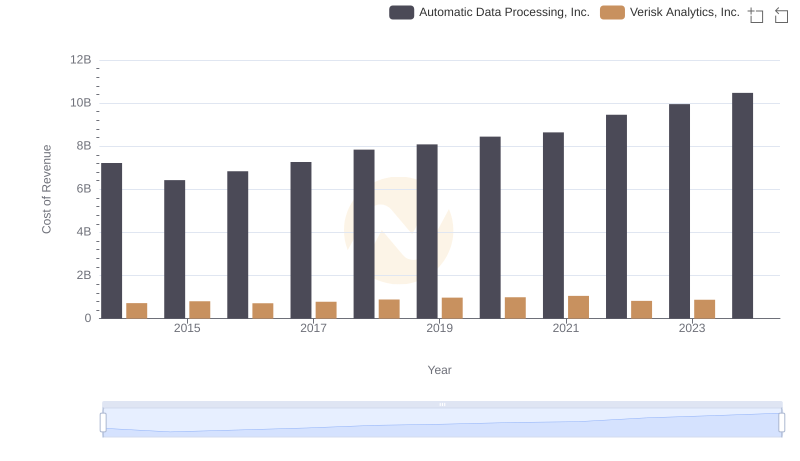
Cost of Revenue Trends: Automatic Data Processing, Inc. vs Verisk Analytics, Inc.
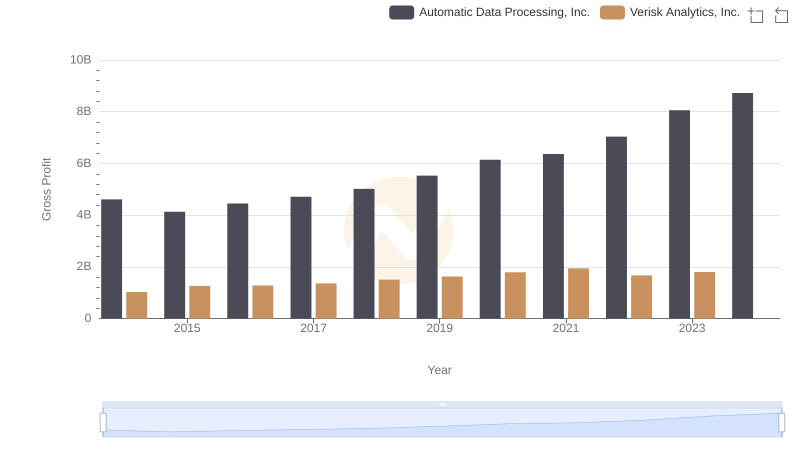
Gross Profit Analysis: Comparing Automatic Data Processing, Inc. and Verisk Analytics, Inc.

Who Optimizes SG&A Costs Better? Automatic Data Processing, Inc. or Verisk Analytics, Inc.
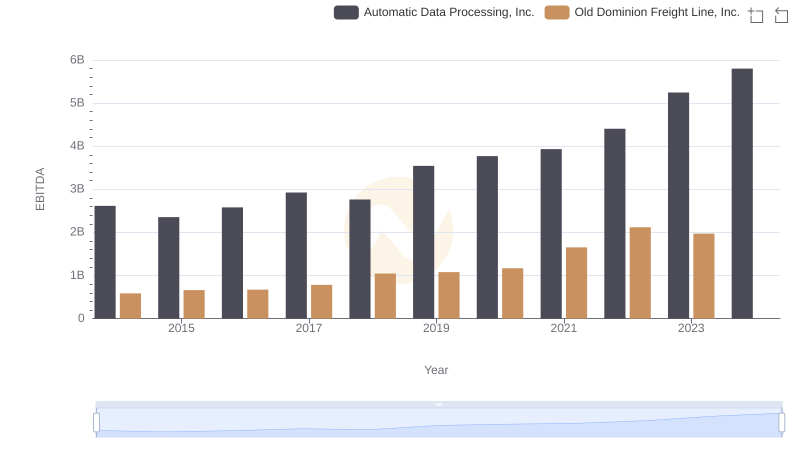
Comprehensive EBITDA Comparison: Automatic Data Processing, Inc. vs Old Dominion Freight Line, Inc.
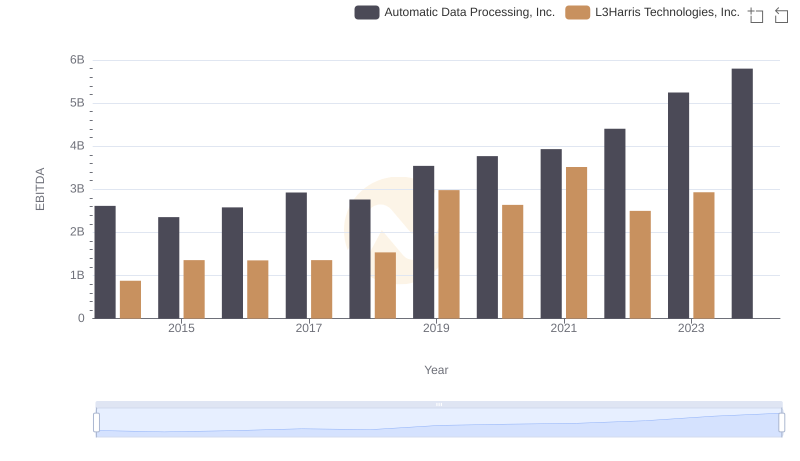
Automatic Data Processing, Inc. vs L3Harris Technologies, Inc.: In-Depth EBITDA Performance Comparison
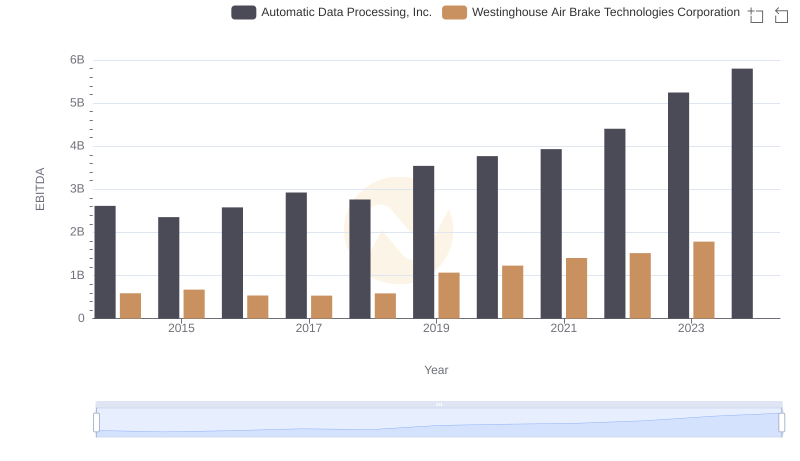
Professional EBITDA Benchmarking: Automatic Data Processing, Inc. vs Westinghouse Air Brake Technologies Corporation
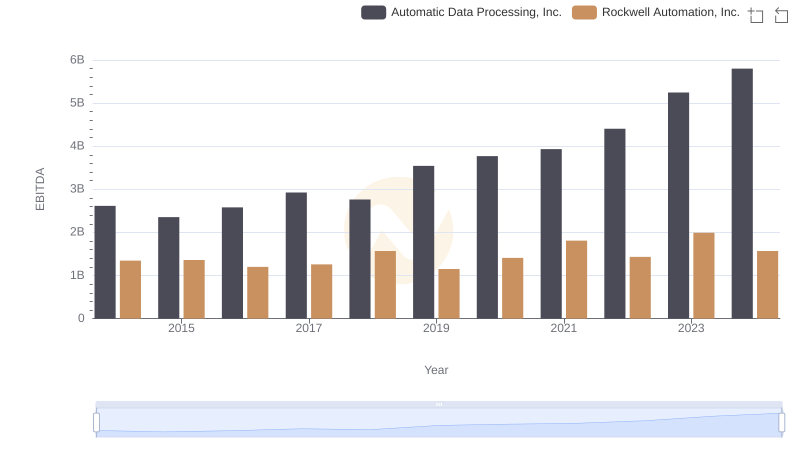
Automatic Data Processing, Inc. and Rockwell Automation, Inc.: A Detailed Examination of EBITDA Performance
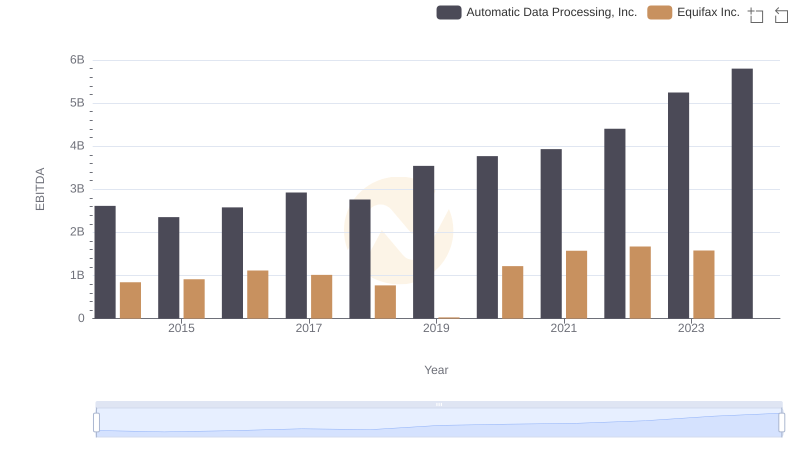
EBITDA Performance Review: Automatic Data Processing, Inc. vs Equifax Inc.