| __timestamp | Automatic Data Processing, Inc. | Verisk Analytics, Inc. |
|---|---|---|
| Wednesday, January 1, 2014 | 7221400000 | 716598000 |
| Thursday, January 1, 2015 | 6427600000 | 803274000 |
| Friday, January 1, 2016 | 6840300000 | 714400000 |
| Sunday, January 1, 2017 | 7269800000 | 783800000 |
| Monday, January 1, 2018 | 7842600000 | 886200000 |
| Tuesday, January 1, 2019 | 8086600000 | 976800000 |
| Wednesday, January 1, 2020 | 8445100000 | 993900000 |
| Friday, January 1, 2021 | 8640300000 | 1057800000 |
| Saturday, January 1, 2022 | 9461900000 | 824600000 |
| Sunday, January 1, 2023 | 9953400000 | 876500000 |
| Monday, January 1, 2024 | 10476700000 |
Igniting the spark of knowledge
In the ever-evolving landscape of the financial sector, understanding cost dynamics is crucial. Over the past decade, Automatic Data Processing, Inc. (ADP) and Verisk Analytics, Inc. have showcased intriguing trends in their cost of revenue. From 2014 to 2023, ADP's cost of revenue has surged by approximately 45%, reflecting a robust growth trajectory. In contrast, Verisk Analytics experienced a more modest increase of around 22% over the same period. Notably, ADP's cost of revenue consistently outpaced Verisk's, highlighting its expansive operational scale. However, the data for 2024 remains incomplete for Verisk, suggesting potential shifts in their financial strategy. This comparative analysis underscores the importance of strategic cost management in maintaining competitive advantage. As we look to the future, these trends offer valuable insights into the financial health and operational efficiency of these industry giants.

Automatic Data Processing, Inc. vs Verisk Analytics, Inc.: Examining Key Revenue Metrics
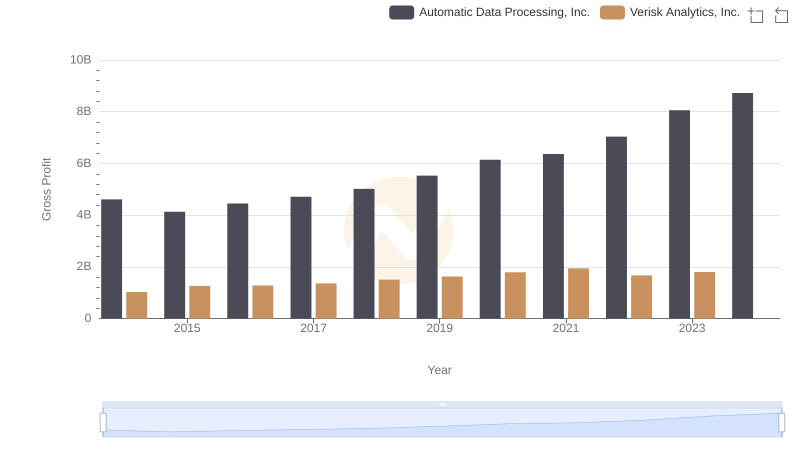
Gross Profit Analysis: Comparing Automatic Data Processing, Inc. and Verisk Analytics, Inc.

Comparing Cost of Revenue Efficiency: Automatic Data Processing, Inc. vs Rockwell Automation, Inc.

Who Optimizes SG&A Costs Better? Automatic Data Processing, Inc. or Verisk Analytics, Inc.
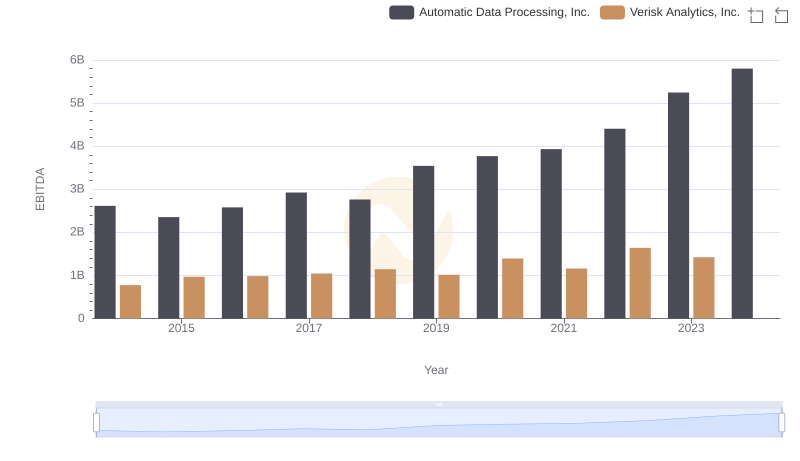
EBITDA Metrics Evaluated: Automatic Data Processing, Inc. vs Verisk Analytics, Inc.