| __timestamp | Automatic Data Processing, Inc. | Owens Corning |
|---|---|---|
| Wednesday, January 1, 2014 | 4611400000 | 976000000 |
| Thursday, January 1, 2015 | 4133200000 | 1153000000 |
| Friday, January 1, 2016 | 4450200000 | 1381000000 |
| Sunday, January 1, 2017 | 4712600000 | 1572000000 |
| Monday, January 1, 2018 | 5016700000 | 1632000000 |
| Tuesday, January 1, 2019 | 5526700000 | 1609000000 |
| Wednesday, January 1, 2020 | 6144700000 | 1610000000 |
| Friday, January 1, 2021 | 6365100000 | 2217000000 |
| Saturday, January 1, 2022 | 7036400000 | 2616000000 |
| Sunday, January 1, 2023 | 8058800000 | 2683000000 |
| Monday, January 1, 2024 | 8725900000 |
Cracking the code
In the ever-evolving landscape of American business, Automatic Data Processing, Inc. (ADP) and Owens Corning stand as pillars of their respective industries. From 2014 to 2023, ADP's gross profit surged by approximately 89%, reflecting its robust growth in the payroll and human resources sector. In contrast, Owens Corning, a leader in building materials, saw a more modest increase of around 175% over the same period.
ADP's gross profit consistently climbed, peaking in 2023, while Owens Corning experienced a steady rise, with a notable jump in 2021. This divergence highlights the resilience of ADP's business model amidst economic fluctuations. However, Owens Corning's growth trajectory underscores its strategic adaptations in the construction industry.
While ADP's data extends into 2024, Owens Corning's figures are absent, leaving room for speculation on its future performance.
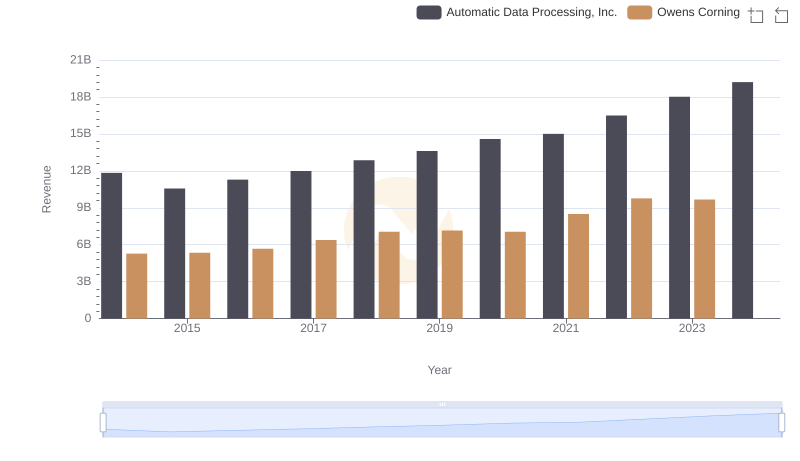
Automatic Data Processing, Inc. vs Owens Corning: Annual Revenue Growth Compared
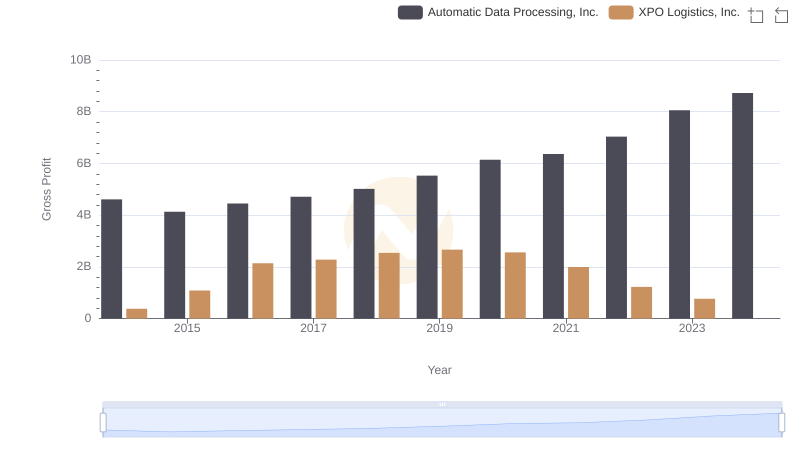
Gross Profit Comparison: Automatic Data Processing, Inc. and XPO Logistics, Inc. Trends
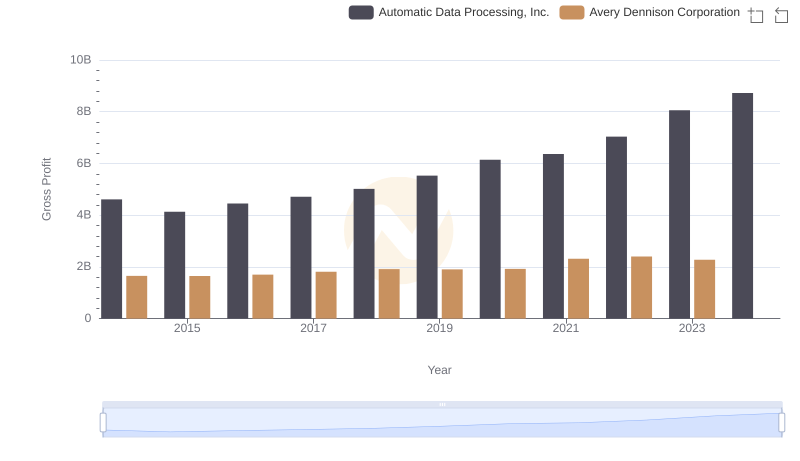
Automatic Data Processing, Inc. vs Avery Dennison Corporation: A Gross Profit Performance Breakdown
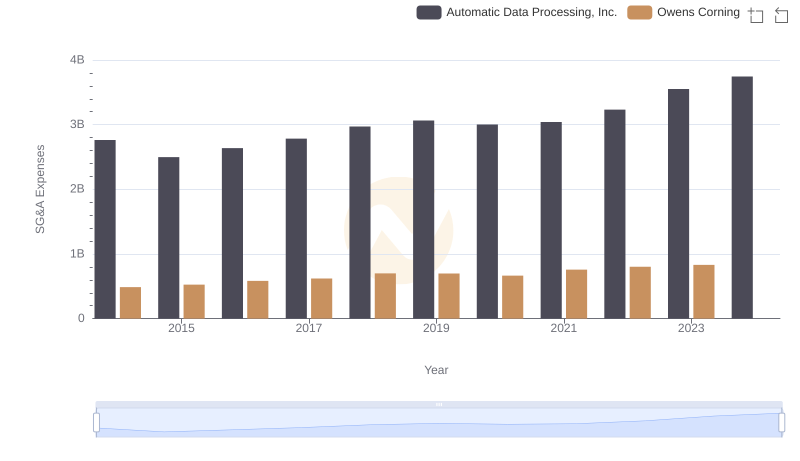
Automatic Data Processing, Inc. vs Owens Corning: SG&A Expense Trends

Gross Profit Trends Compared: Automatic Data Processing, Inc. vs ZTO Express (Cayman) Inc.
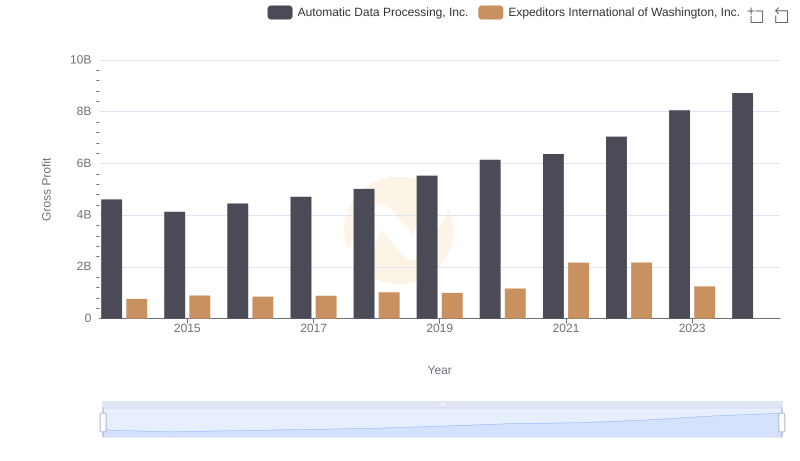
Gross Profit Comparison: Automatic Data Processing, Inc. and Expeditors International of Washington, Inc. Trends
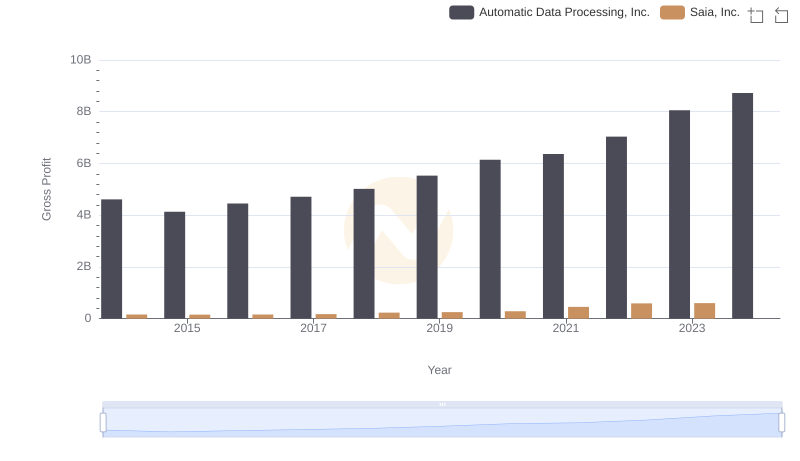
Automatic Data Processing, Inc. and Saia, Inc.: A Detailed Gross Profit Analysis
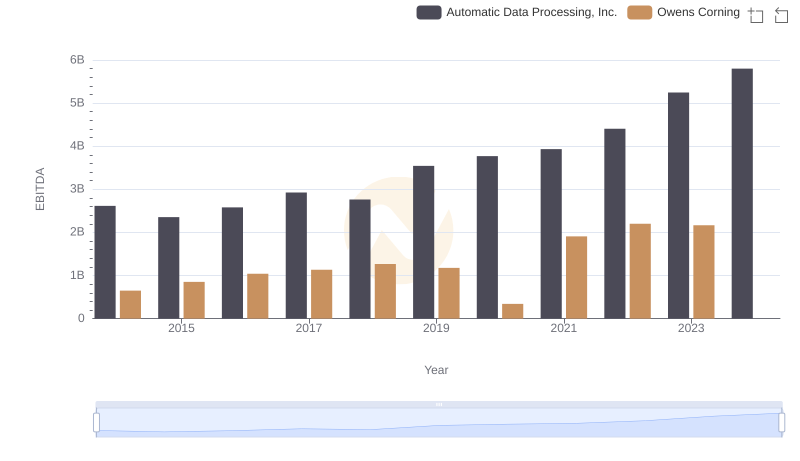
Automatic Data Processing, Inc. vs Owens Corning: In-Depth EBITDA Performance Comparison