| __timestamp | Automatic Data Processing, Inc. | Owens Corning |
|---|---|---|
| Wednesday, January 1, 2014 | 2762400000 | 487000000 |
| Thursday, January 1, 2015 | 2496900000 | 525000000 |
| Friday, January 1, 2016 | 2637000000 | 584000000 |
| Sunday, January 1, 2017 | 2783200000 | 620000000 |
| Monday, January 1, 2018 | 2971500000 | 700000000 |
| Tuesday, January 1, 2019 | 3064200000 | 698000000 |
| Wednesday, January 1, 2020 | 3003000000 | 664000000 |
| Friday, January 1, 2021 | 3040500000 | 757000000 |
| Saturday, January 1, 2022 | 3233200000 | 803000000 |
| Sunday, January 1, 2023 | 3551400000 | 831000000 |
| Monday, January 1, 2024 | 3778900000 |
Igniting the spark of knowledge
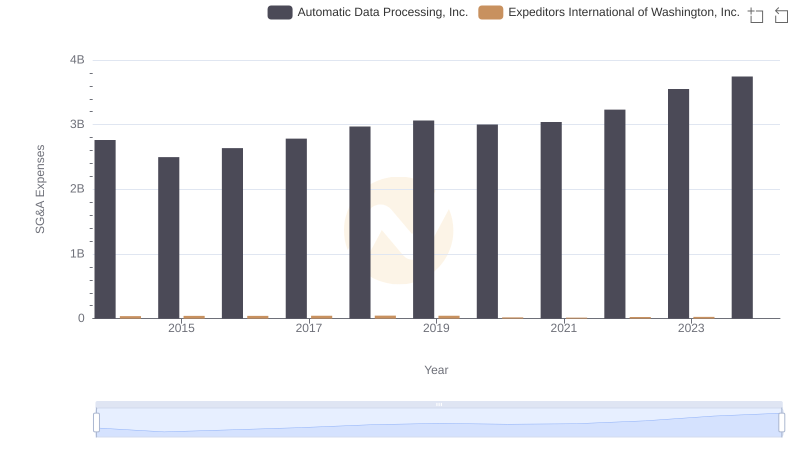
In the world of corporate finance, Selling, General, and Administrative (SG&A) expenses are a critical measure of a company's operational efficiency. This analysis compares the SG&A expense trends of Automatic Data Processing, Inc. (ADP) and Owens Corning from 2014 to 2023.
ADP has seen a steady increase in its SG&A expenses, growing by approximately 36% over the decade. This trend reflects the company's strategic investments in expanding its operations and enhancing its service offerings. In contrast, Owens Corning's SG&A expenses have grown by about 71%, indicating a more aggressive expansion strategy.
While ADP's data extends into 2024, Owens Corning's figures for that year are missing, suggesting potential reporting delays or strategic shifts. This discrepancy highlights the importance of complete data for accurate financial analysis.
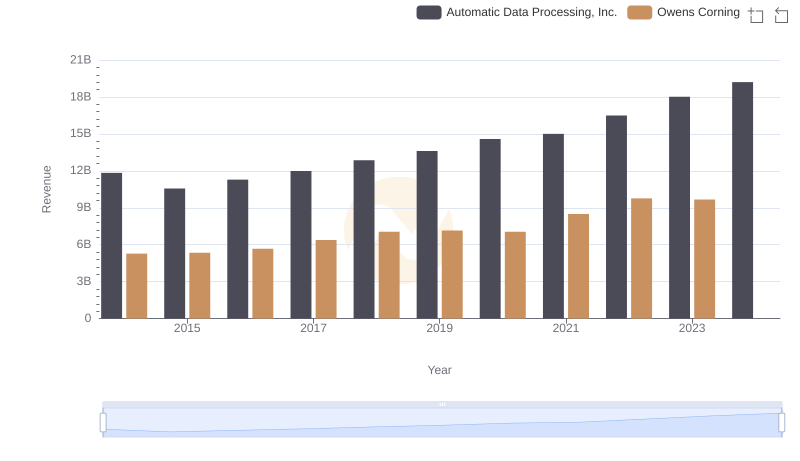
Automatic Data Processing, Inc. vs Owens Corning: Annual Revenue Growth Compared
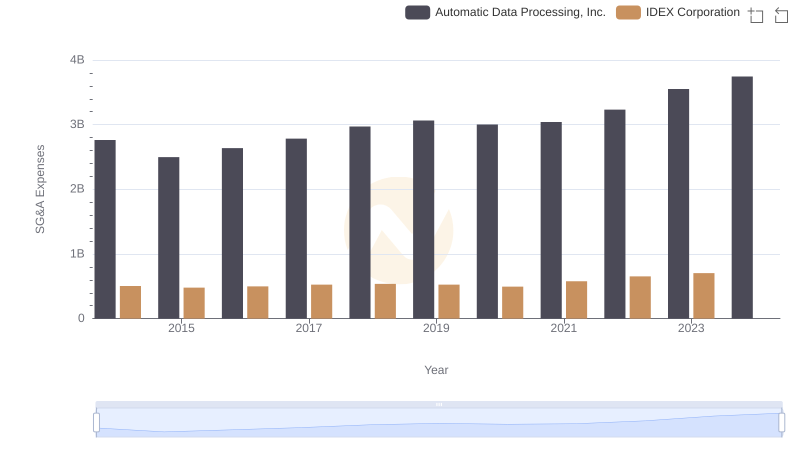
Selling, General, and Administrative Costs: Automatic Data Processing, Inc. vs IDEX Corporation
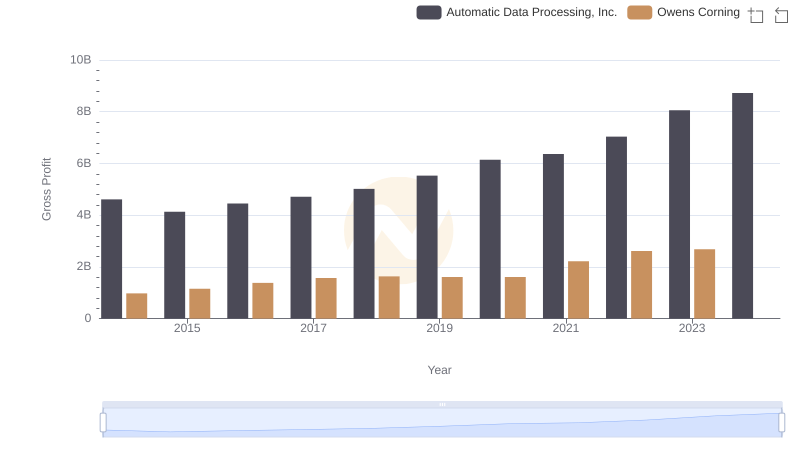
Gross Profit Analysis: Comparing Automatic Data Processing, Inc. and Owens Corning
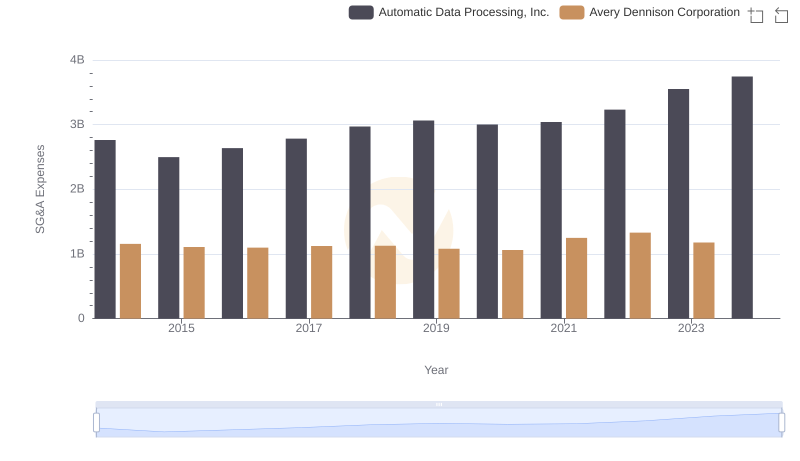
Who Optimizes SG&A Costs Better? Automatic Data Processing, Inc. or Avery Dennison Corporation
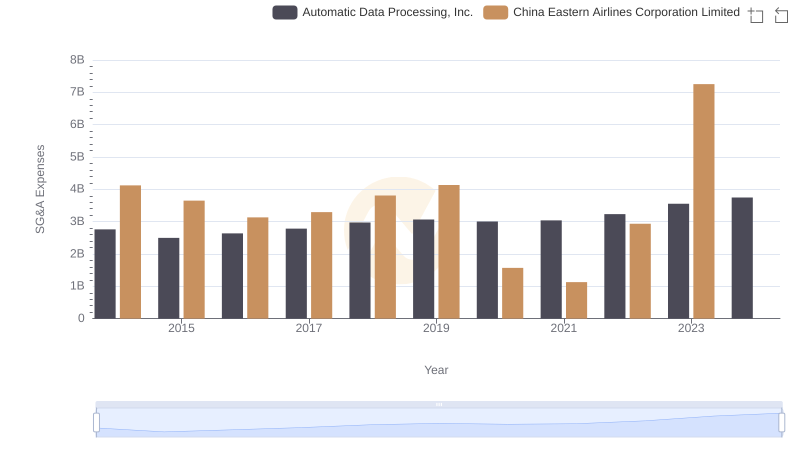
Comparing SG&A Expenses: Automatic Data Processing, Inc. vs China Eastern Airlines Corporation Limited Trends and Insights
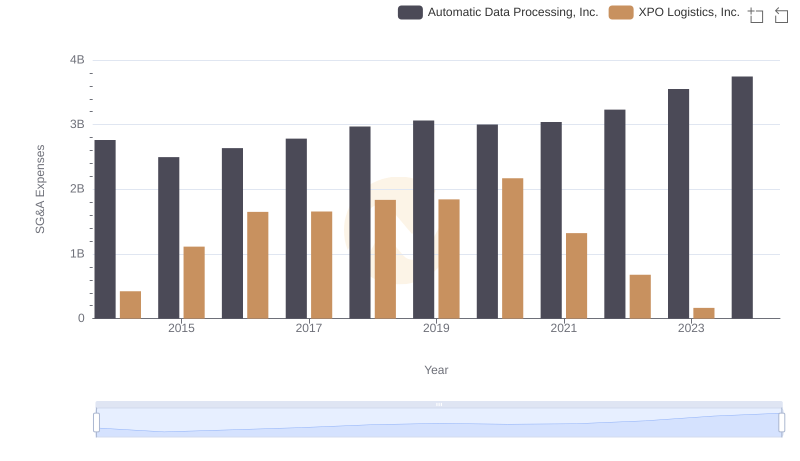
SG&A Efficiency Analysis: Comparing Automatic Data Processing, Inc. and XPO Logistics, Inc.
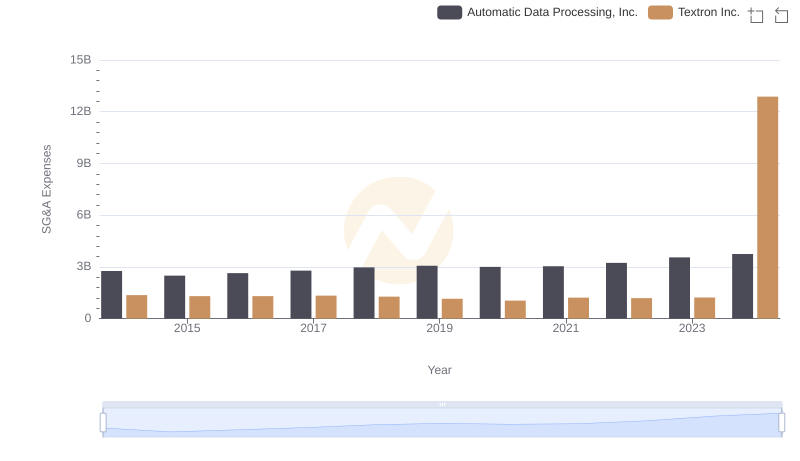
Operational Costs Compared: SG&A Analysis of Automatic Data Processing, Inc. and Textron Inc.
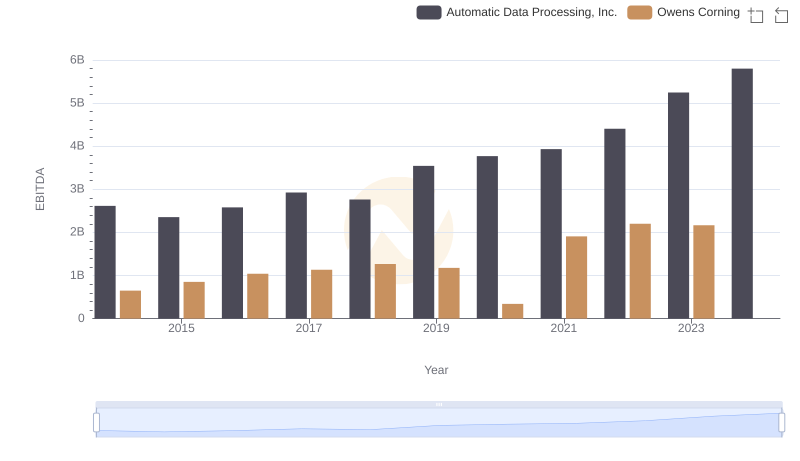
Automatic Data Processing, Inc. vs Owens Corning: In-Depth EBITDA Performance Comparison

Comparing SG&A Expenses: Automatic Data Processing, Inc. vs ZTO Express (Cayman) Inc. Trends and Insights
Comparing SG&A Expenses: Automatic Data Processing, Inc. vs Expeditors International of Washington, Inc. Trends and Insights