| __timestamp | Automatic Data Processing, Inc. | XPO Logistics, Inc. |
|---|---|---|
| Wednesday, January 1, 2014 | 4611400000 | 381600000 |
| Thursday, January 1, 2015 | 4133200000 | 1084800000 |
| Friday, January 1, 2016 | 4450200000 | 2139300000 |
| Sunday, January 1, 2017 | 4712600000 | 2279700000 |
| Monday, January 1, 2018 | 5016700000 | 2541000000 |
| Tuesday, January 1, 2019 | 5526700000 | 2666000000 |
| Wednesday, January 1, 2020 | 6144700000 | 2563000000 |
| Friday, January 1, 2021 | 6365100000 | 1994000000 |
| Saturday, January 1, 2022 | 7036400000 | 1227000000 |
| Sunday, January 1, 2023 | 8058800000 | 770000000 |
| Monday, January 1, 2024 | 8725900000 | 915000000 |
In pursuit of knowledge
In the ever-evolving landscape of corporate finance, the gross profit trends of Automatic Data Processing, Inc. (ADP) and XPO Logistics, Inc. offer a fascinating glimpse into the dynamics of two industry leaders. From 2014 to 2023, ADP's gross profit surged by approximately 89%, reflecting its robust growth and market resilience. In contrast, XPO Logistics experienced a more modest increase of around 102% until 2019, after which its profits began to decline, highlighting the challenges faced in the logistics sector.
ADP's consistent upward trajectory, peaking at an impressive $8.7 billion in 2024, underscores its strategic prowess in the payroll and human resources industry. Meanwhile, XPO's fluctuating profits, with a notable dip to $770 million in 2023, suggest a need for strategic realignment. This comparison not only highlights the contrasting fortunes of these two companies but also serves as a testament to the diverse challenges and opportunities within their respective sectors.
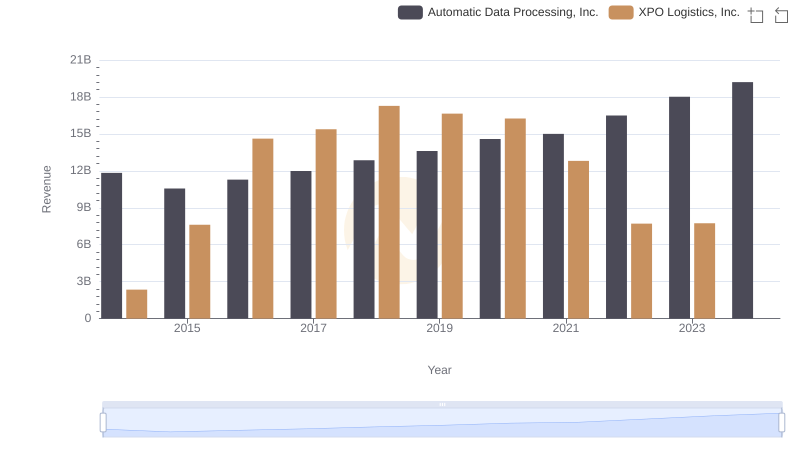
Automatic Data Processing, Inc. and XPO Logistics, Inc.: A Comprehensive Revenue Analysis
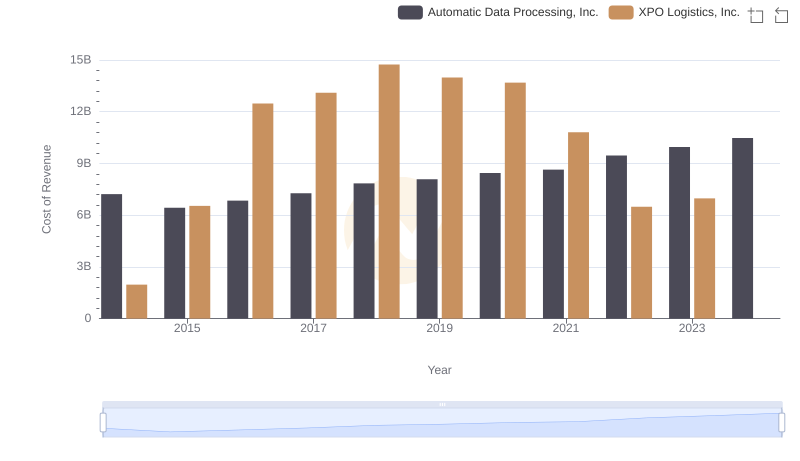
Cost Insights: Breaking Down Automatic Data Processing, Inc. and XPO Logistics, Inc.'s Expenses
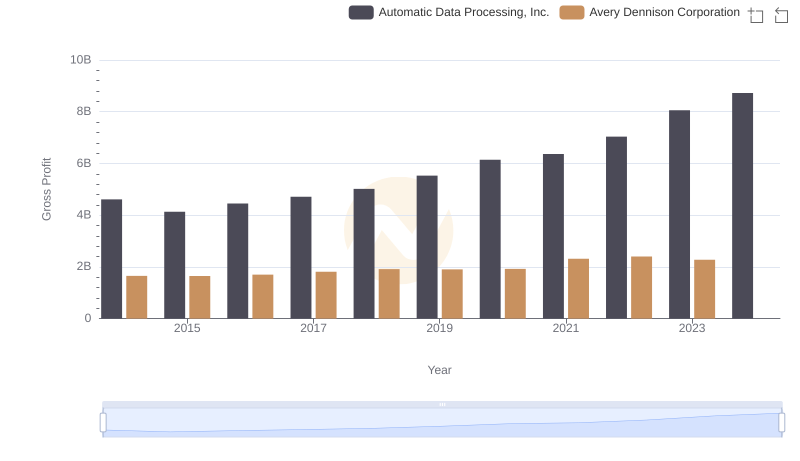
Automatic Data Processing, Inc. vs Avery Dennison Corporation: A Gross Profit Performance Breakdown
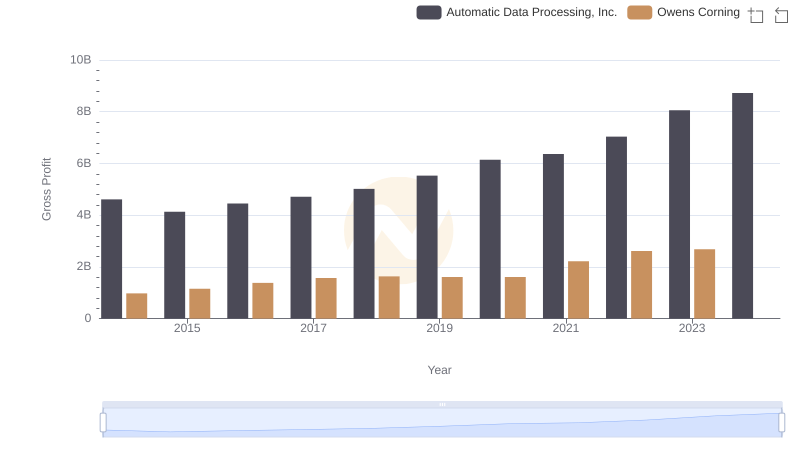
Gross Profit Analysis: Comparing Automatic Data Processing, Inc. and Owens Corning

Gross Profit Trends Compared: Automatic Data Processing, Inc. vs ZTO Express (Cayman) Inc.
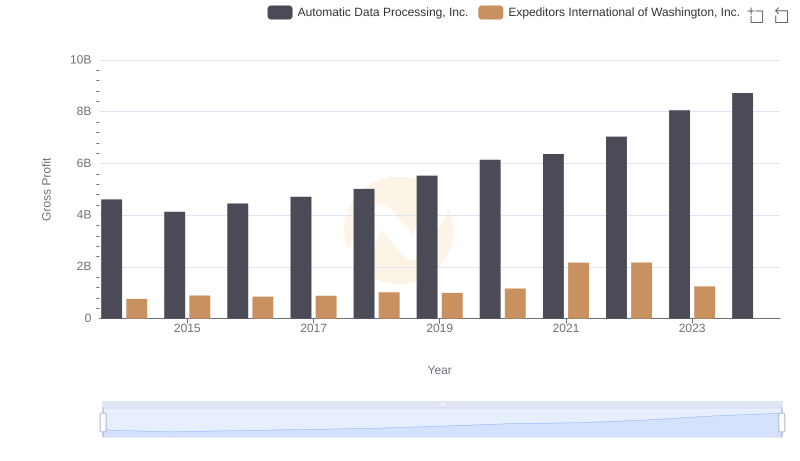
Gross Profit Comparison: Automatic Data Processing, Inc. and Expeditors International of Washington, Inc. Trends
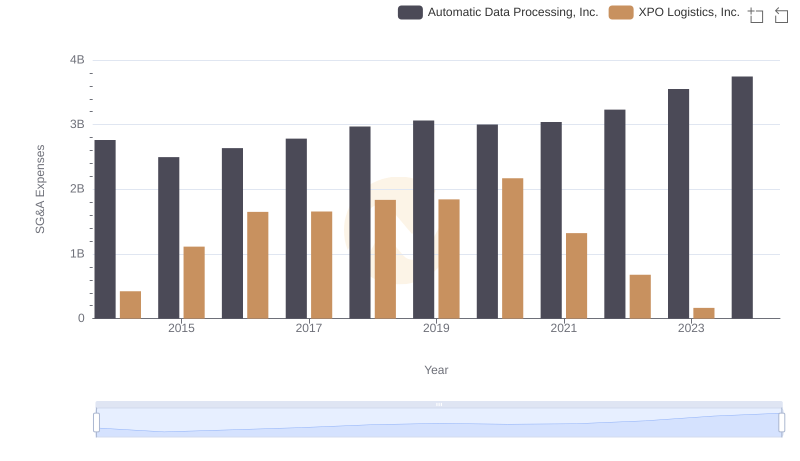
SG&A Efficiency Analysis: Comparing Automatic Data Processing, Inc. and XPO Logistics, Inc.
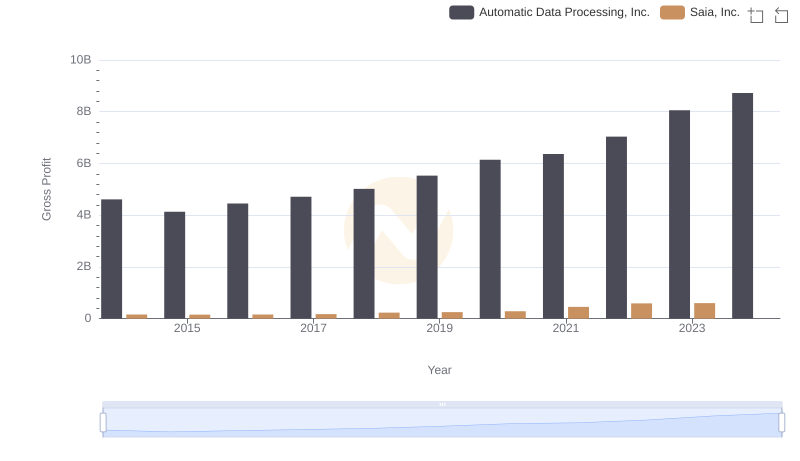
Automatic Data Processing, Inc. and Saia, Inc.: A Detailed Gross Profit Analysis
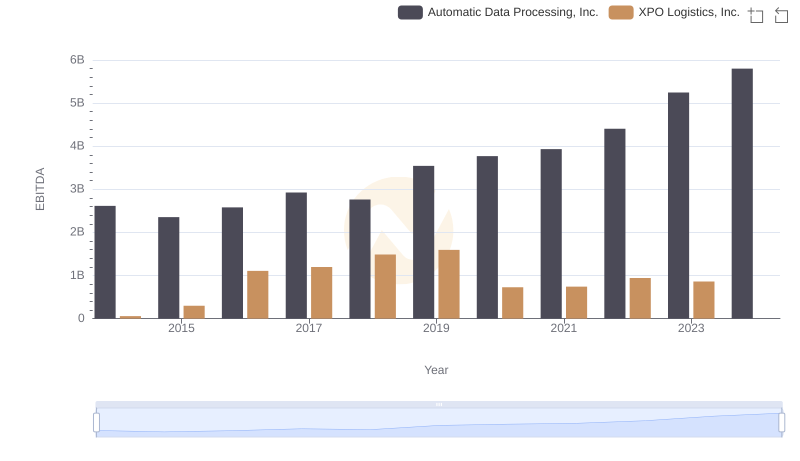
A Professional Review of EBITDA: Automatic Data Processing, Inc. Compared to XPO Logistics, Inc.