| __timestamp | Automatic Data Processing, Inc. | Owens Corning |
|---|---|---|
| Wednesday, January 1, 2014 | 11832800000 | 5276000000 |
| Thursday, January 1, 2015 | 10560800000 | 5350000000 |
| Friday, January 1, 2016 | 11290500000 | 5677000000 |
| Sunday, January 1, 2017 | 11982400000 | 6384000000 |
| Monday, January 1, 2018 | 12859300000 | 7057000000 |
| Tuesday, January 1, 2019 | 13613300000 | 7160000000 |
| Wednesday, January 1, 2020 | 14589800000 | 7055000000 |
| Friday, January 1, 2021 | 15005400000 | 8498000000 |
| Saturday, January 1, 2022 | 16498300000 | 9761000000 |
| Sunday, January 1, 2023 | 18012200000 | 9677000000 |
| Monday, January 1, 2024 | 19202600000 |
Unlocking the unknown
In the ever-evolving landscape of American business, Automatic Data Processing, Inc. (ADP) and Owens Corning stand as titans in their respective industries. Over the past decade, ADP has demonstrated a robust revenue growth, increasing by approximately 62% from 2014 to 2023. This growth trajectory highlights ADP's resilience and adaptability in the face of economic fluctuations.
Owens Corning, a leader in building materials, has also shown commendable growth, with its revenue rising by about 83% from 2014 to 2022. However, data for 2024 is currently unavailable, leaving a gap in the narrative of its financial journey.
This comparison not only underscores the dynamic nature of these companies but also reflects broader economic trends. As we look to the future, the continued performance of these industry leaders will be a key indicator of market health and innovation.
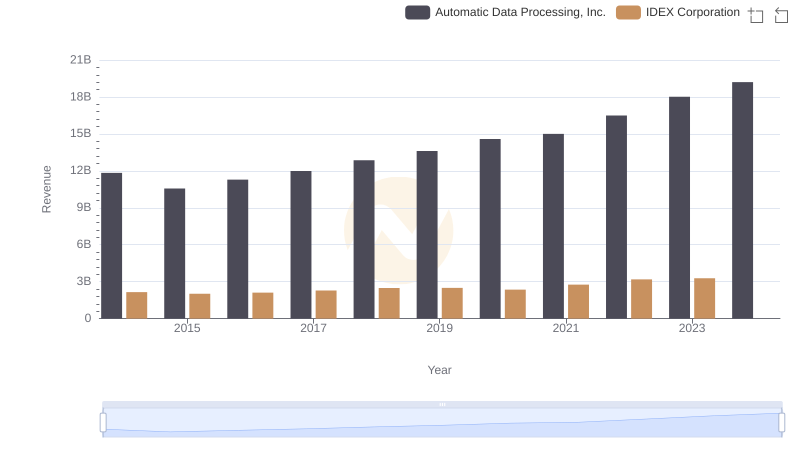
Breaking Down Revenue Trends: Automatic Data Processing, Inc. vs IDEX Corporation
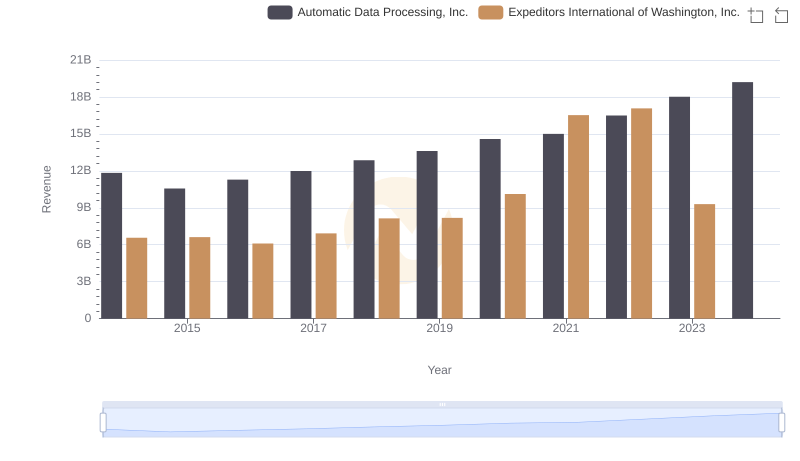
Comparing Revenue Performance: Automatic Data Processing, Inc. or Expeditors International of Washington, Inc.?
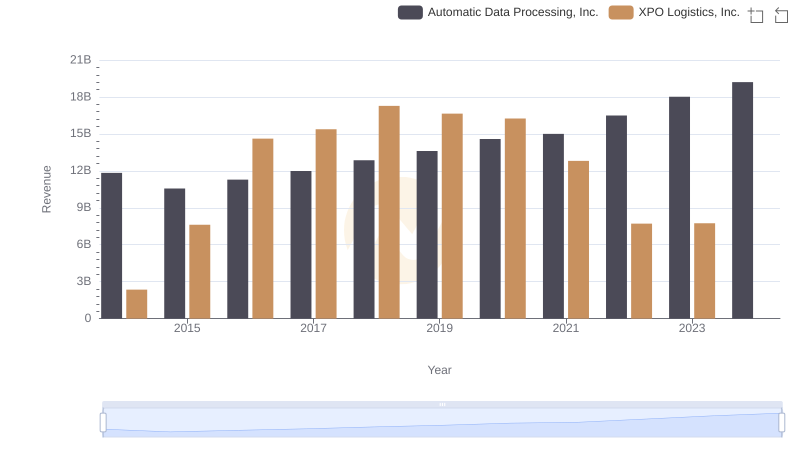
Automatic Data Processing, Inc. and XPO Logistics, Inc.: A Comprehensive Revenue Analysis
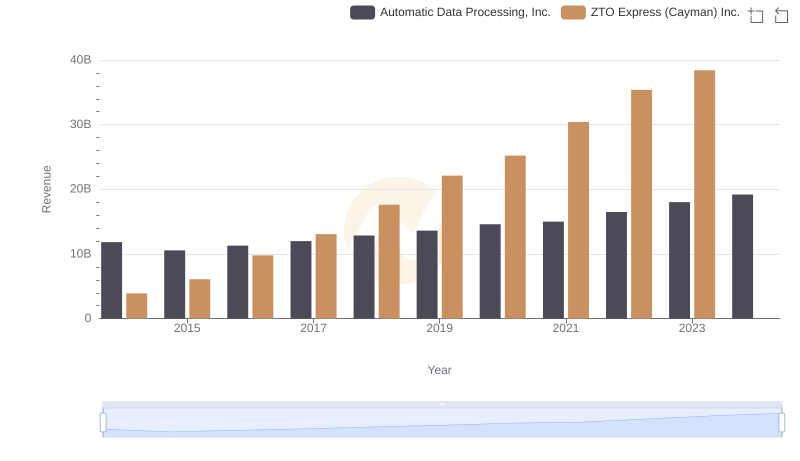
Revenue Insights: Automatic Data Processing, Inc. and ZTO Express (Cayman) Inc. Performance Compared
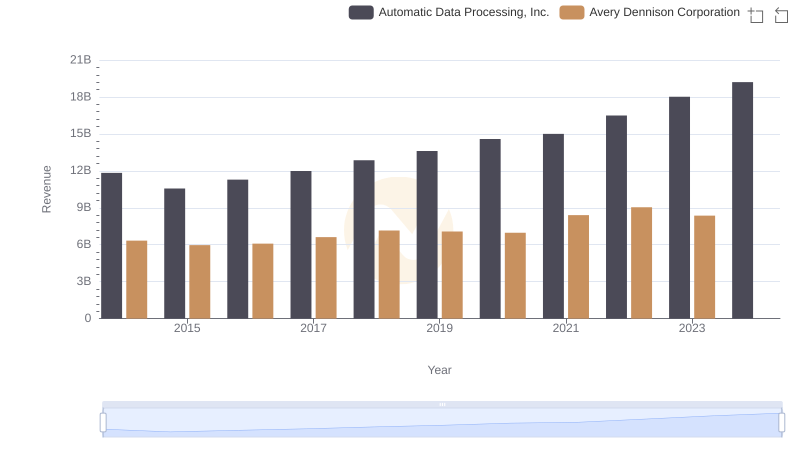
Automatic Data Processing, Inc. or Avery Dennison Corporation: Who Leads in Yearly Revenue?
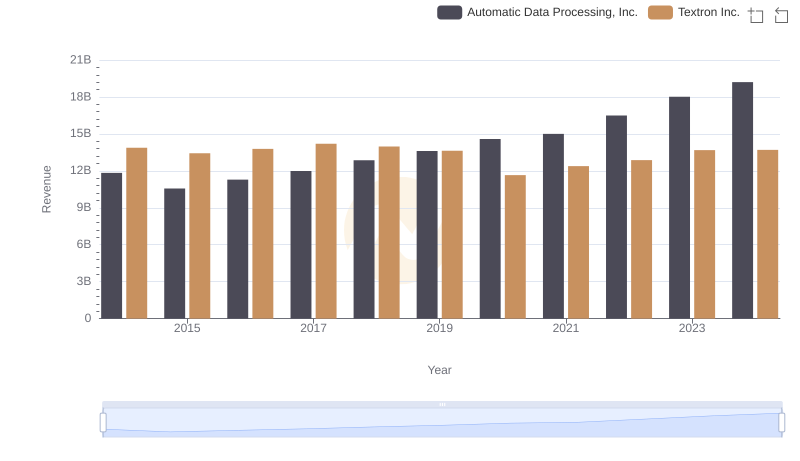
Revenue Showdown: Automatic Data Processing, Inc. vs Textron Inc.
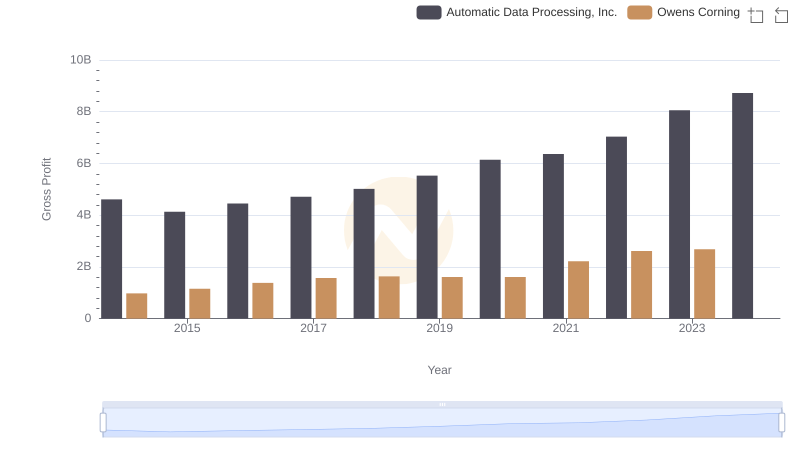
Gross Profit Analysis: Comparing Automatic Data Processing, Inc. and Owens Corning
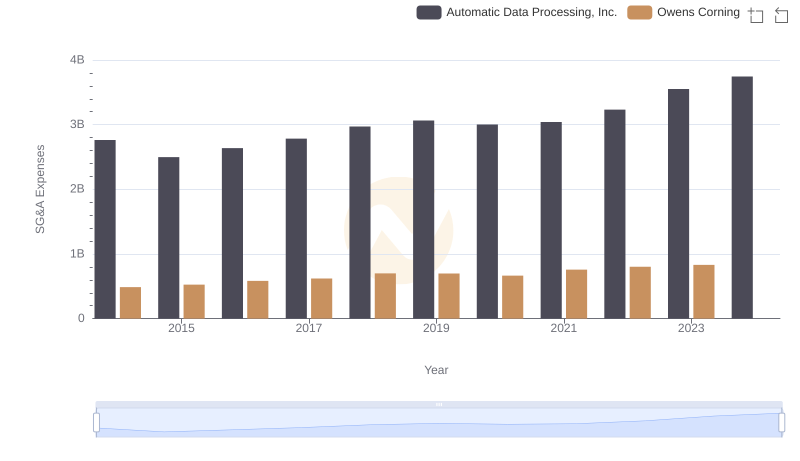
Automatic Data Processing, Inc. vs Owens Corning: SG&A Expense Trends
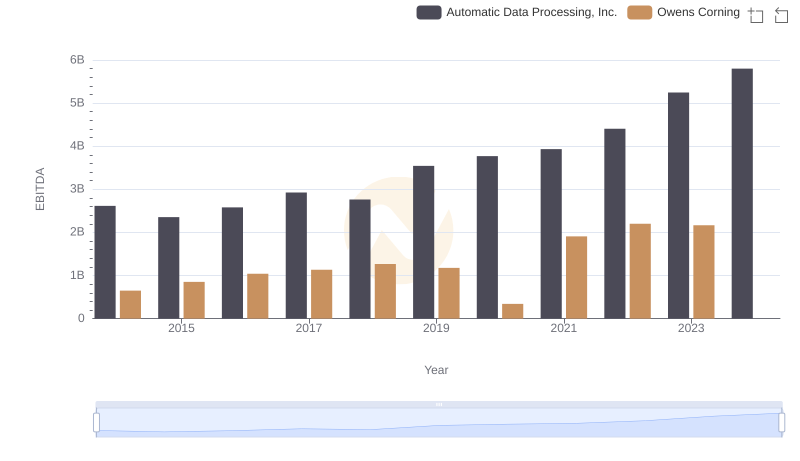
Automatic Data Processing, Inc. vs Owens Corning: In-Depth EBITDA Performance Comparison