| __timestamp | Global Payments Inc. | Rentokil Initial plc |
|---|---|---|
| Wednesday, January 1, 2014 | 2773718000 | 1740800000 |
| Thursday, January 1, 2015 | 2898150000 | 1759000000 |
| Friday, January 1, 2016 | 3370976000 | 2168100000 |
| Sunday, January 1, 2017 | 3975163000 | 2412300000 |
| Monday, January 1, 2018 | 3366366000 | 2472300000 |
| Tuesday, January 1, 2019 | 4911892000 | 2676200000 |
| Wednesday, January 1, 2020 | 7423558000 | 2789400000 |
| Friday, January 1, 2021 | 8523762000 | 2953900000 |
| Saturday, January 1, 2022 | 8975515000 | 3714000000 |
| Sunday, January 1, 2023 | 9654419000 | 5375000000 |
| Monday, January 1, 2024 | 10105894000 |
Unveiling the hidden dimensions of data
In the dynamic world of global business, revenue growth is a key indicator of success. Over the past decade, Global Payments Inc. and Rentokil Initial plc have been in a fascinating race. From 2014 to 2023, Global Payments Inc. has consistently outpaced Rentokil Initial plc, with a staggering 248% increase in revenue, reaching nearly $9.7 billion in 2023. In contrast, Rentokil Initial plc has shown a steady growth of 209%, culminating in a revenue of $5.4 billion in the same year.
This trend highlights Global Payments Inc.'s robust expansion strategy, particularly evident in the significant leap between 2019 and 2020, where revenue surged by over 50%. Meanwhile, Rentokil Initial plc's growth, though slower, reflects a stable and consistent upward trajectory. As these companies continue to evolve, their revenue trends offer valuable insights into their strategic priorities and market positioning.
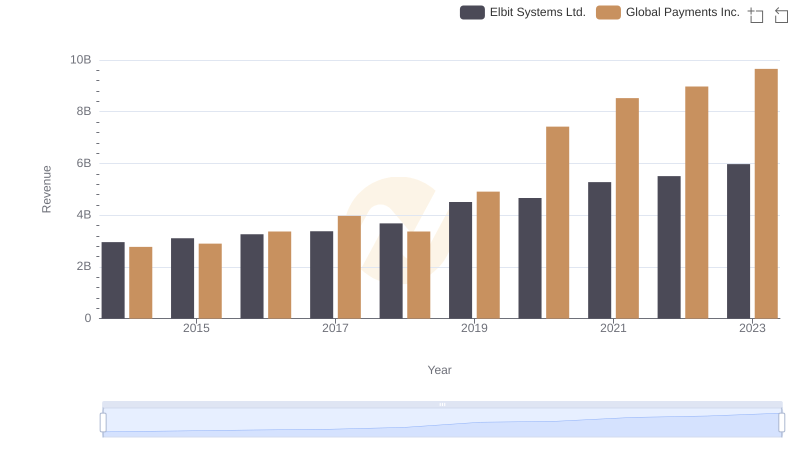
Global Payments Inc. vs Elbit Systems Ltd.: Annual Revenue Growth Compared

Breaking Down Revenue Trends: Global Payments Inc. vs C.H. Robinson Worldwide, Inc.
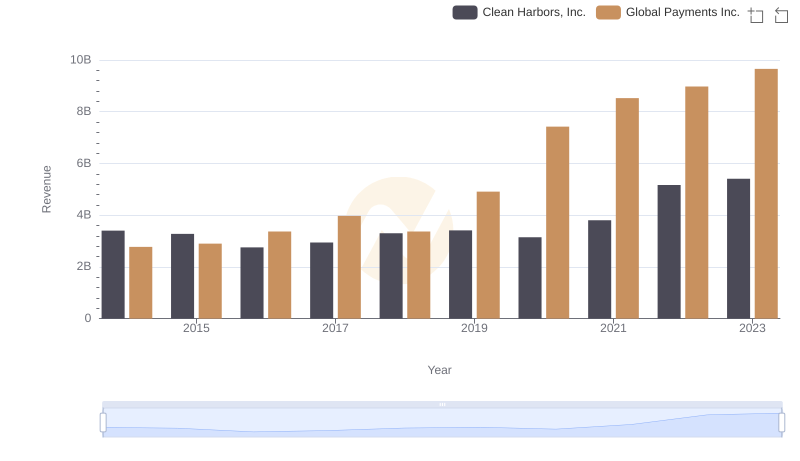
Global Payments Inc. or Clean Harbors, Inc.: Who Leads in Yearly Revenue?
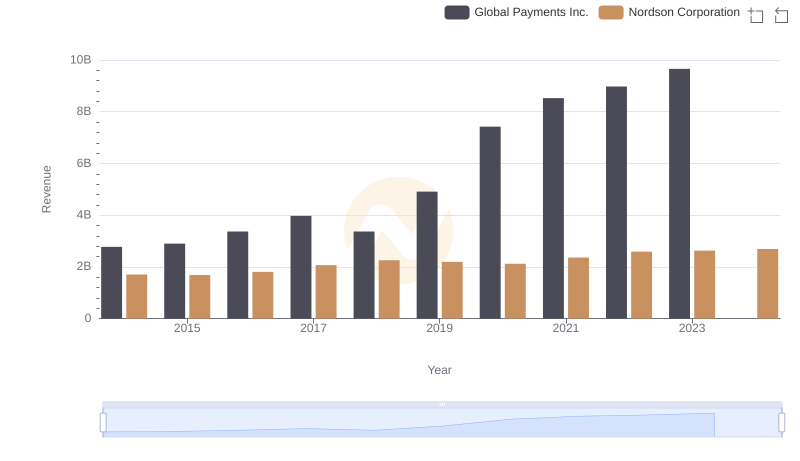
Global Payments Inc. vs Nordson Corporation: Examining Key Revenue Metrics
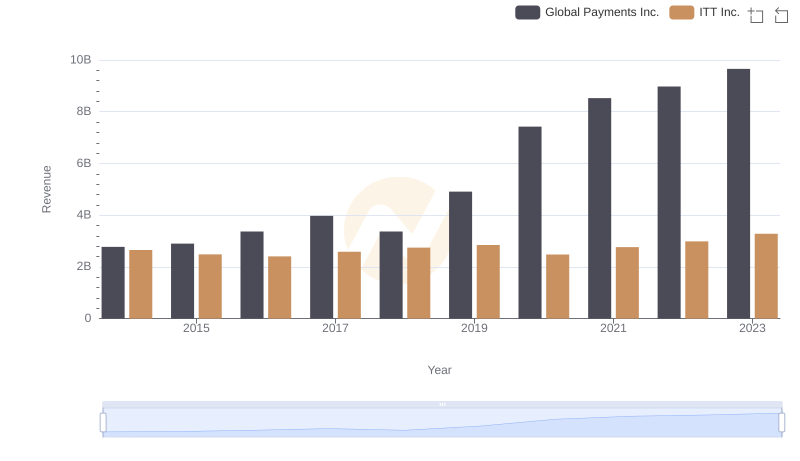
Global Payments Inc. vs ITT Inc.: Examining Key Revenue Metrics
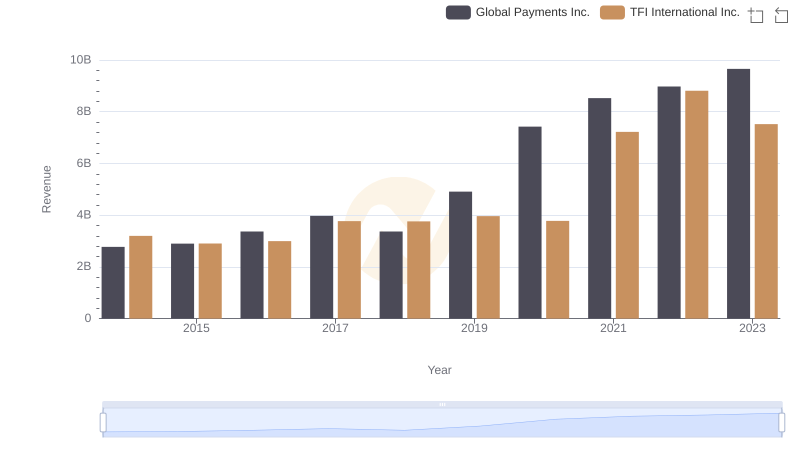
Global Payments Inc. vs TFI International Inc.: Annual Revenue Growth Compared
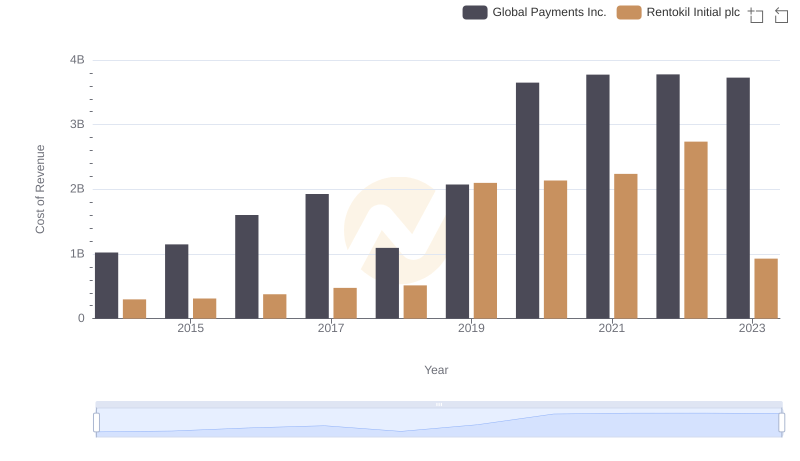
Analyzing Cost of Revenue: Global Payments Inc. and Rentokil Initial plc
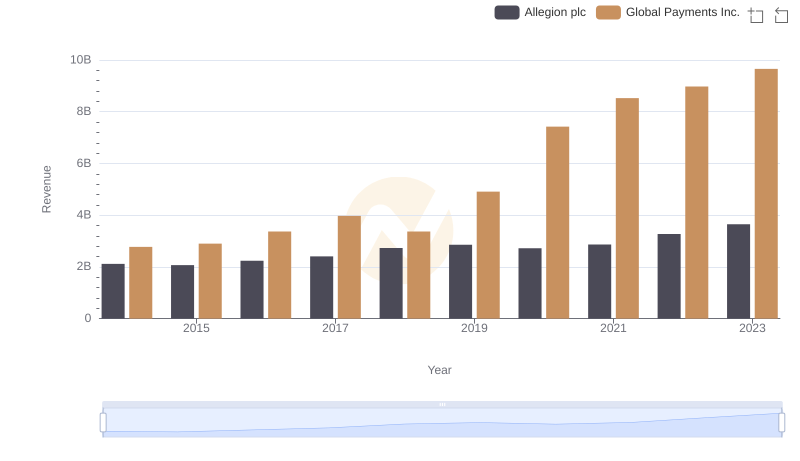
Global Payments Inc. vs Allegion plc: Examining Key Revenue Metrics
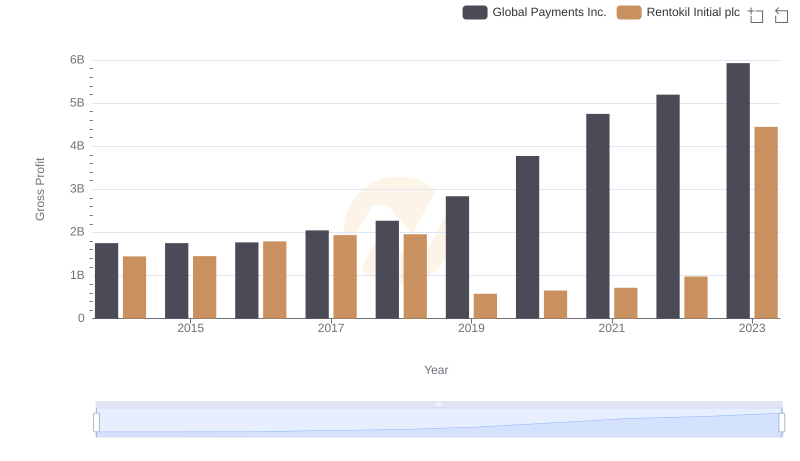
Global Payments Inc. vs Rentokil Initial plc: A Gross Profit Performance Breakdown
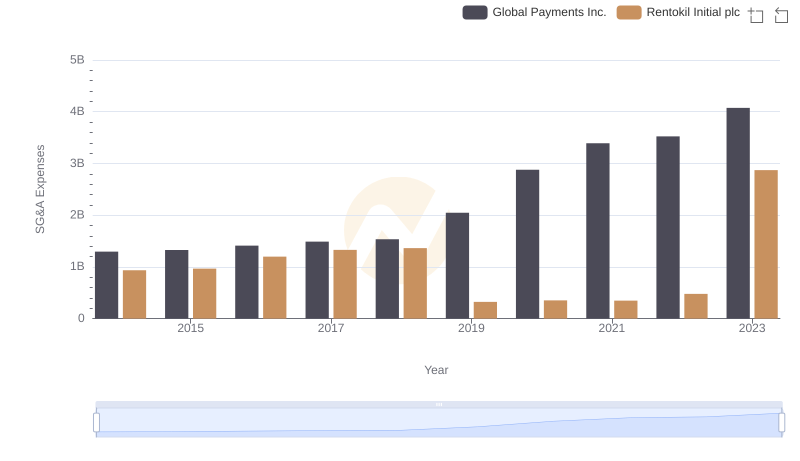
Cost Management Insights: SG&A Expenses for Global Payments Inc. and Rentokil Initial plc