| __timestamp | Clean Harbors, Inc. | Global Payments Inc. |
|---|---|---|
| Wednesday, January 1, 2014 | 3401636000 | 2773718000 |
| Thursday, January 1, 2015 | 3275137000 | 2898150000 |
| Friday, January 1, 2016 | 2755226000 | 3370976000 |
| Sunday, January 1, 2017 | 2944978000 | 3975163000 |
| Monday, January 1, 2018 | 3300303000 | 3366366000 |
| Tuesday, January 1, 2019 | 3412190000 | 4911892000 |
| Wednesday, January 1, 2020 | 3144097000 | 7423558000 |
| Friday, January 1, 2021 | 3805566000 | 8523762000 |
| Saturday, January 1, 2022 | 5166605000 | 8975515000 |
| Sunday, January 1, 2023 | 5409152000 | 9654419000 |
| Monday, January 1, 2024 | 5889952000 | 10105894000 |
Igniting the spark of knowledge
In the ever-evolving landscape of corporate finance, two giants, Global Payments Inc. and Clean Harbors, Inc., have been vying for supremacy in annual revenue. Over the past decade, Global Payments Inc. has consistently outpaced Clean Harbors, Inc., showcasing a remarkable growth trajectory. From 2014 to 2023, Global Payments Inc. saw its revenue soar by approximately 248%, reaching a peak in 2023. In contrast, Clean Harbors, Inc. experienced a more modest growth of around 59% during the same period.
The data reveals a pivotal moment in 2020 when Global Payments Inc. surged ahead, nearly doubling its revenue compared to Clean Harbors, Inc. This trend continued, with Global Payments Inc. maintaining a lead of over 78% by 2023. As the financial world watches, these two companies exemplify the dynamic nature of revenue generation in the modern economy.
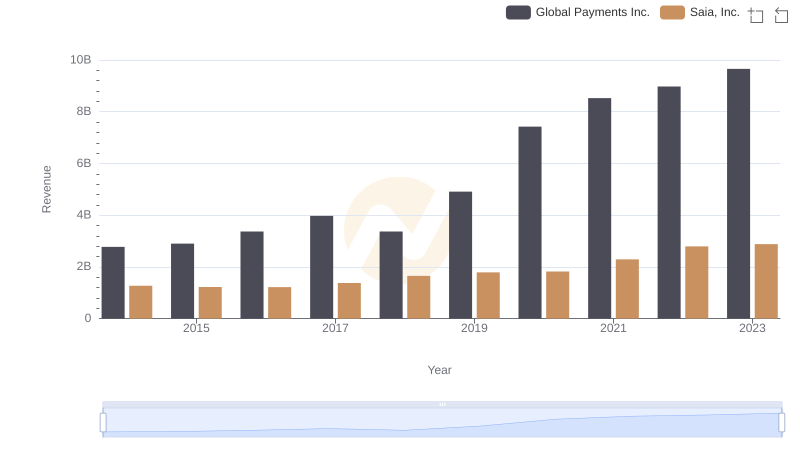
Global Payments Inc. and Saia, Inc.: A Comprehensive Revenue Analysis
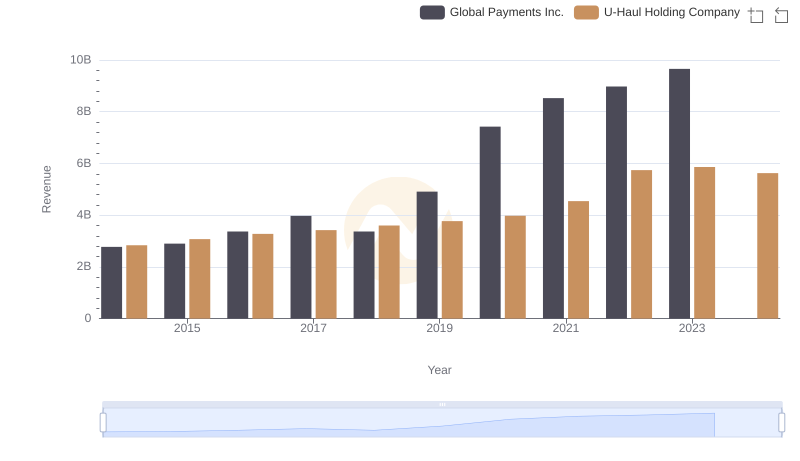
Comparing Revenue Performance: Global Payments Inc. or U-Haul Holding Company?
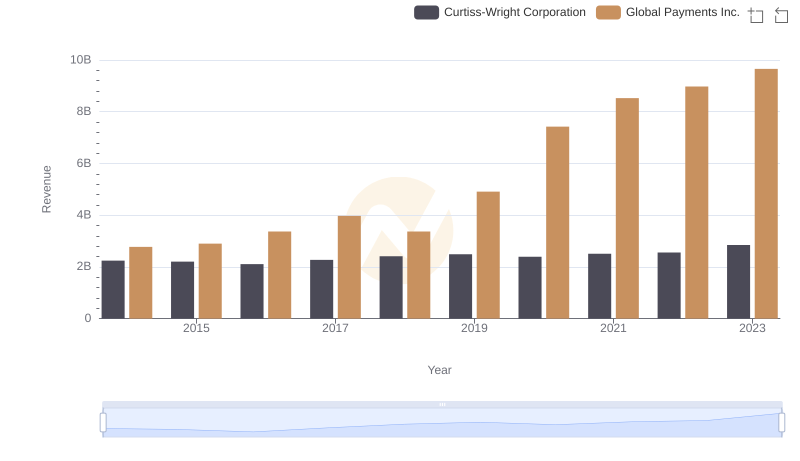
Annual Revenue Comparison: Global Payments Inc. vs Curtiss-Wright Corporation
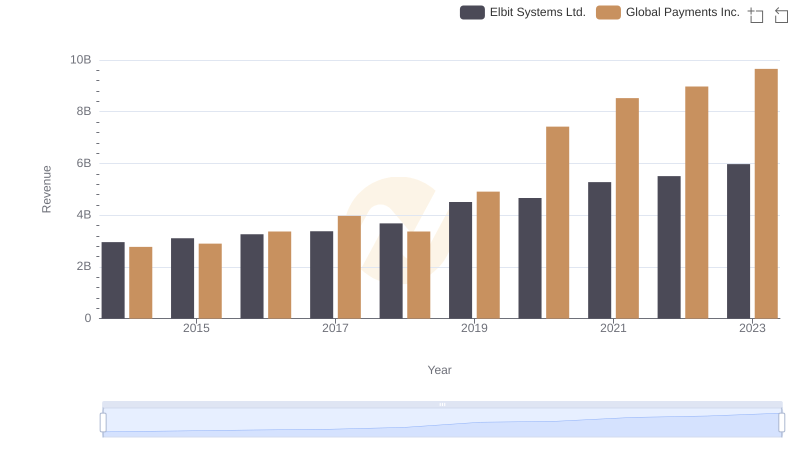
Global Payments Inc. vs Elbit Systems Ltd.: Annual Revenue Growth Compared

Breaking Down Revenue Trends: Global Payments Inc. vs C.H. Robinson Worldwide, Inc.
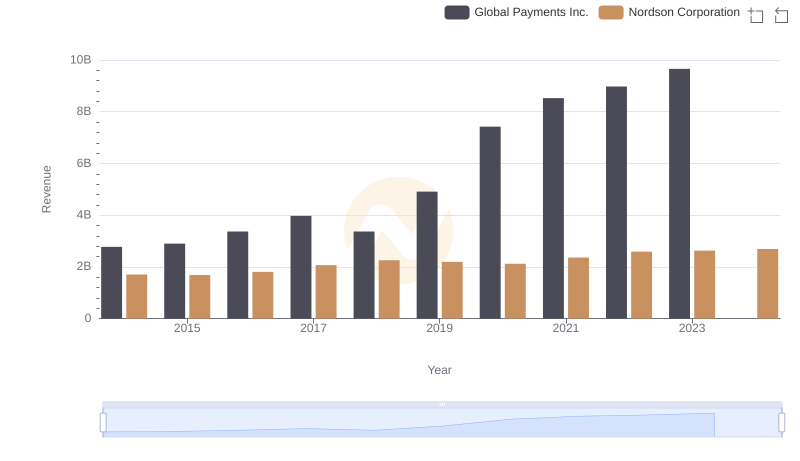
Global Payments Inc. vs Nordson Corporation: Examining Key Revenue Metrics
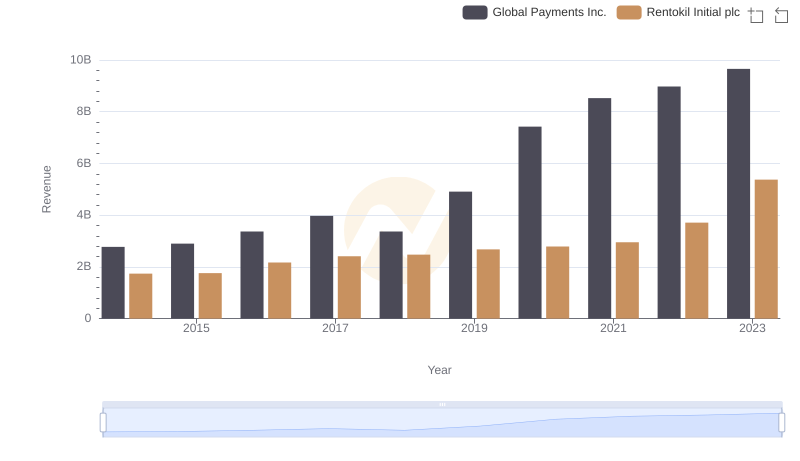
Global Payments Inc. or Rentokil Initial plc: Who Leads in Yearly Revenue?
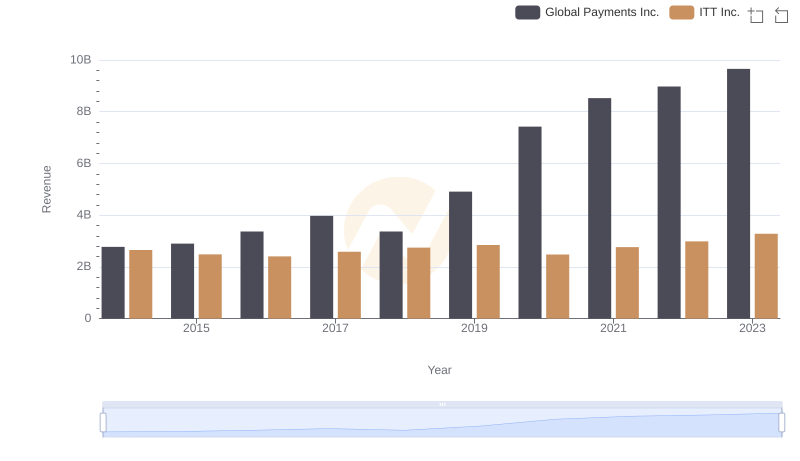
Global Payments Inc. vs ITT Inc.: Examining Key Revenue Metrics

Who Optimizes SG&A Costs Better? Global Payments Inc. or Clean Harbors, Inc.