| __timestamp | Allegion plc | Global Payments Inc. |
|---|---|---|
| Wednesday, January 1, 2014 | 2118300000 | 2773718000 |
| Thursday, January 1, 2015 | 2068100000 | 2898150000 |
| Friday, January 1, 2016 | 2238000000 | 3370976000 |
| Sunday, January 1, 2017 | 2408200000 | 3975163000 |
| Monday, January 1, 2018 | 2731700000 | 3366366000 |
| Tuesday, January 1, 2019 | 2854000000 | 4911892000 |
| Wednesday, January 1, 2020 | 2719900000 | 7423558000 |
| Friday, January 1, 2021 | 2867400000 | 8523762000 |
| Saturday, January 1, 2022 | 3271900000 | 8975515000 |
| Sunday, January 1, 2023 | 3650800000 | 9654419000 |
| Monday, January 1, 2024 | 3772200000 | 10105894000 |
Unlocking the unknown
In the ever-evolving landscape of financial services and security solutions, Global Payments Inc. and Allegion plc have emerged as formidable players. Over the past decade, from 2014 to 2023, these companies have demonstrated remarkable revenue growth, reflecting their strategic prowess and market adaptability.
Global Payments Inc. has seen its revenue soar by approximately 248%, starting from $2.77 billion in 2014 and reaching an impressive $9.65 billion in 2023. This growth underscores the company's successful expansion and innovation in payment technology solutions.
Meanwhile, Allegion plc, a leader in security products and solutions, has experienced a steady revenue increase of around 72%, from $2.12 billion in 2014 to $3.65 billion in 2023. This growth trajectory highlights Allegion's commitment to enhancing security and access control solutions globally.
As these companies continue to innovate and expand, their revenue trends offer valuable insights into the dynamic sectors of payment technology and security solutions.
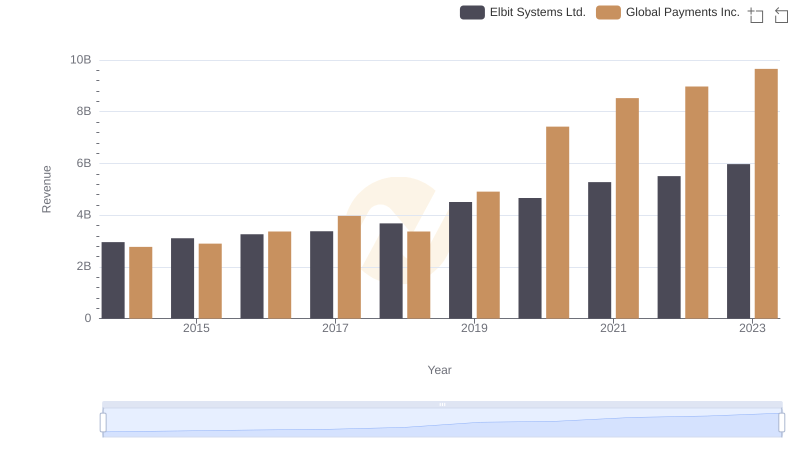
Global Payments Inc. vs Elbit Systems Ltd.: Annual Revenue Growth Compared

Breaking Down Revenue Trends: Global Payments Inc. vs C.H. Robinson Worldwide, Inc.
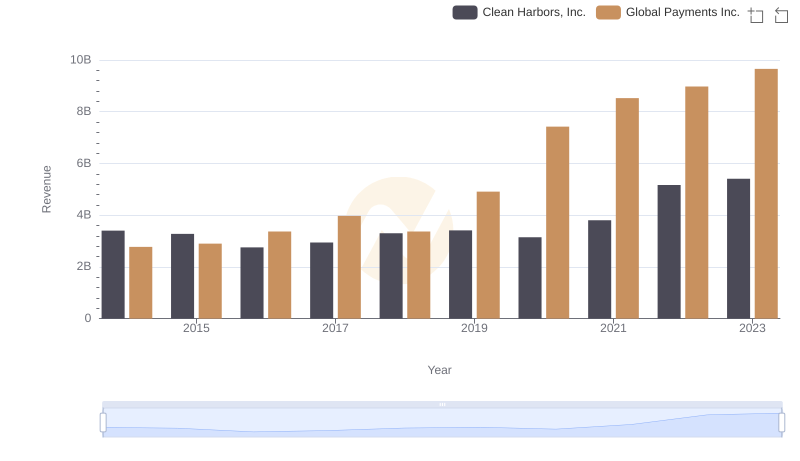
Global Payments Inc. or Clean Harbors, Inc.: Who Leads in Yearly Revenue?
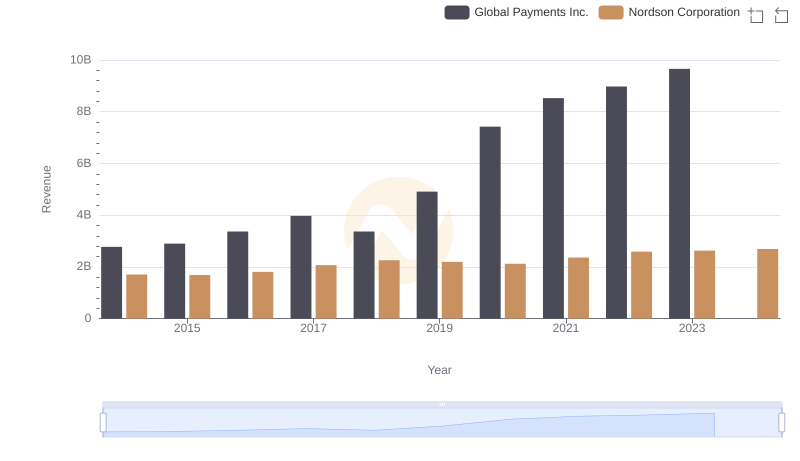
Global Payments Inc. vs Nordson Corporation: Examining Key Revenue Metrics
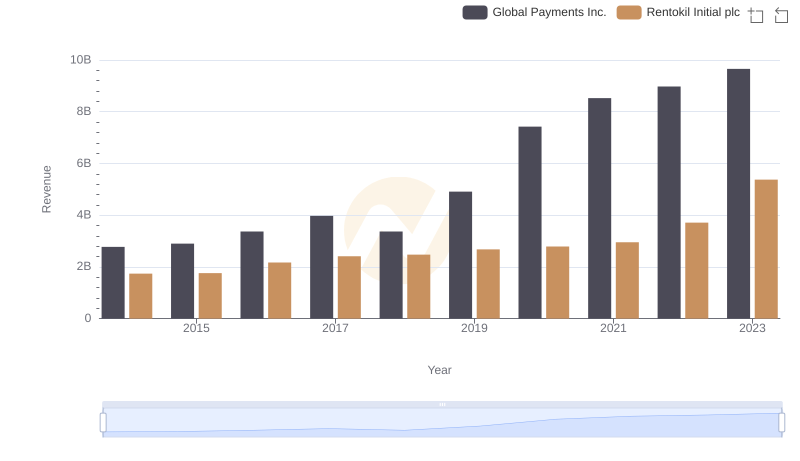
Global Payments Inc. or Rentokil Initial plc: Who Leads in Yearly Revenue?
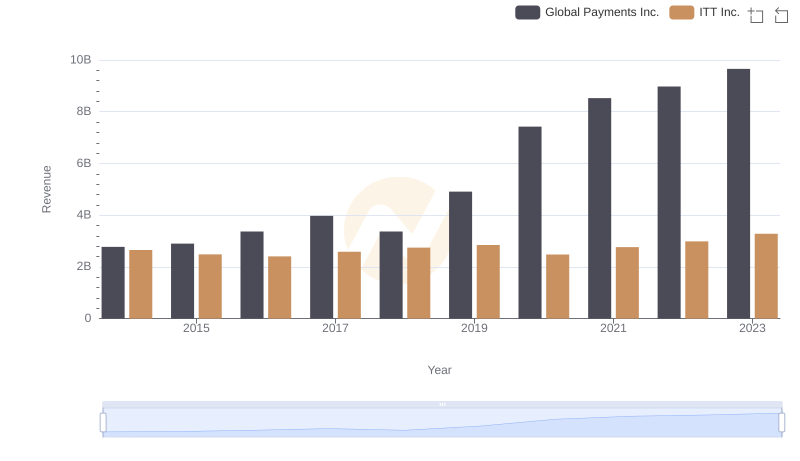
Global Payments Inc. vs ITT Inc.: Examining Key Revenue Metrics
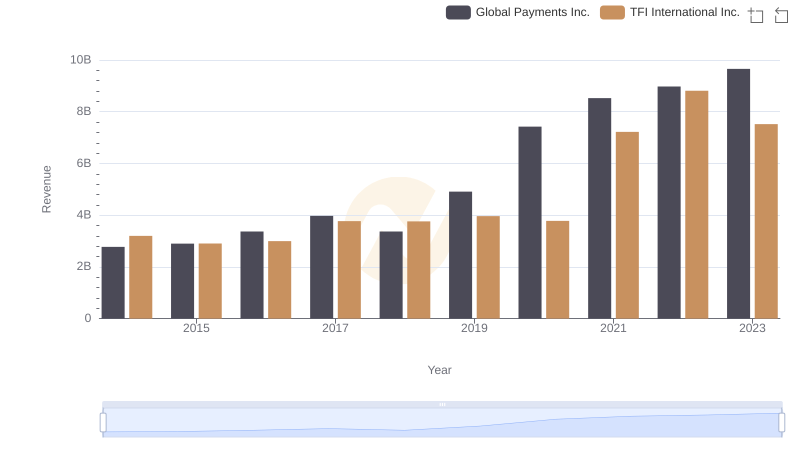
Global Payments Inc. vs TFI International Inc.: Annual Revenue Growth Compared
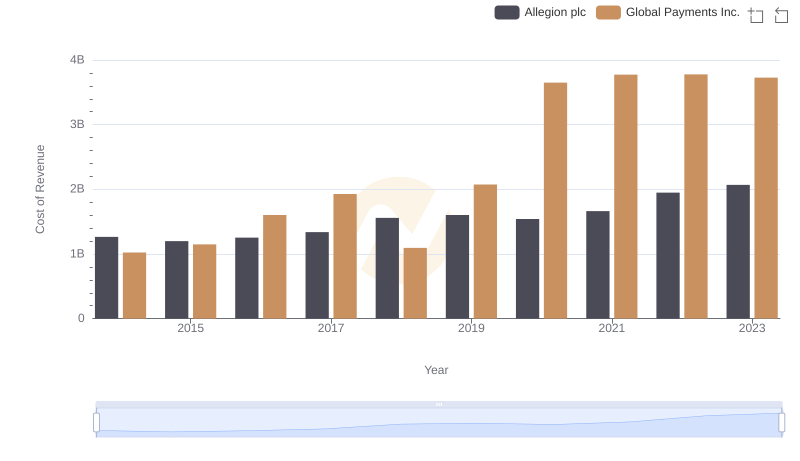
Cost of Revenue Trends: Global Payments Inc. vs Allegion plc
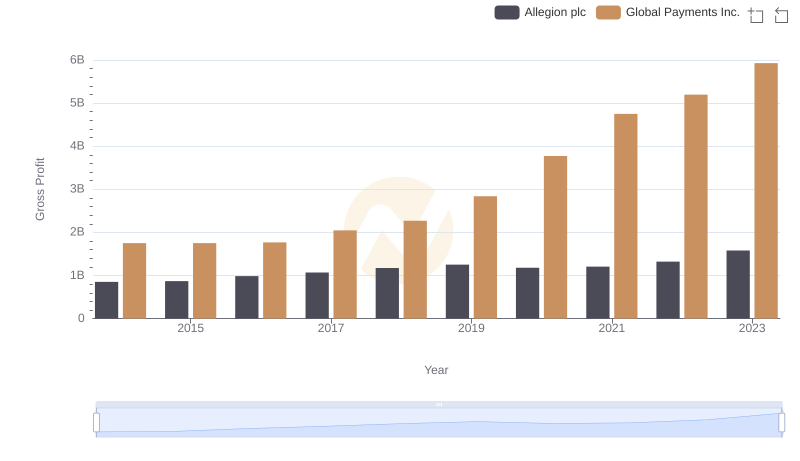
Global Payments Inc. vs Allegion plc: A Gross Profit Performance Breakdown